Ethereum has recently mirrored Bitcoin’s spike in volatility, facing swift rejection near its all-time high levels.
This reversal has injected uncertainty into the short-term outlook, with ETH now retesting key supports that will determine whether the broader bullish trend remains intact.
Ethereum Price Analysis: Technicals
By Shayan
The Daily Chart
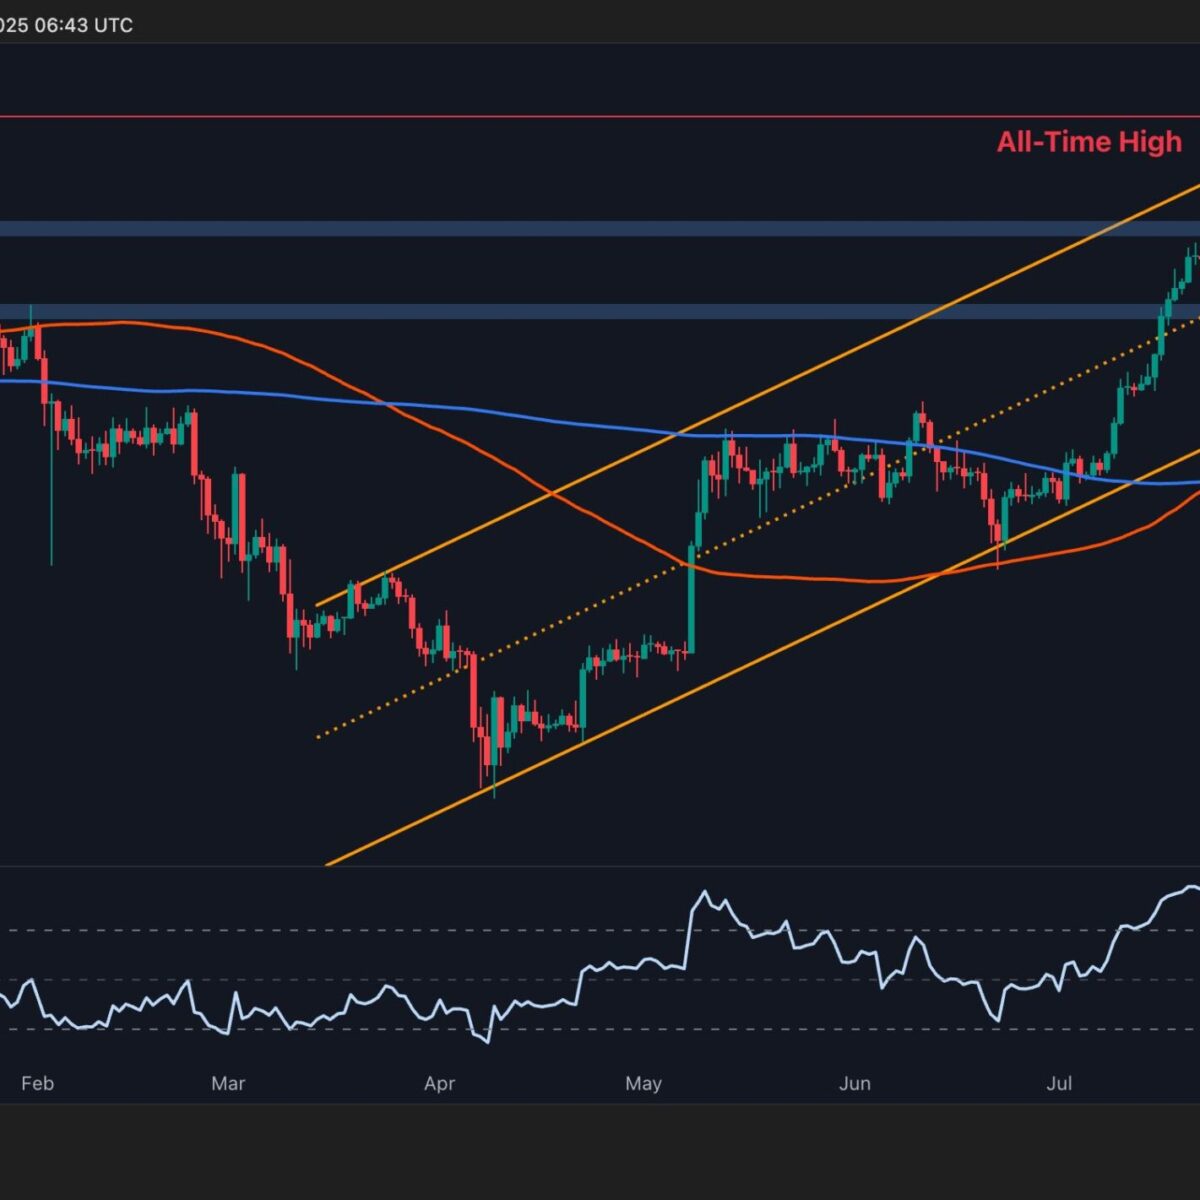
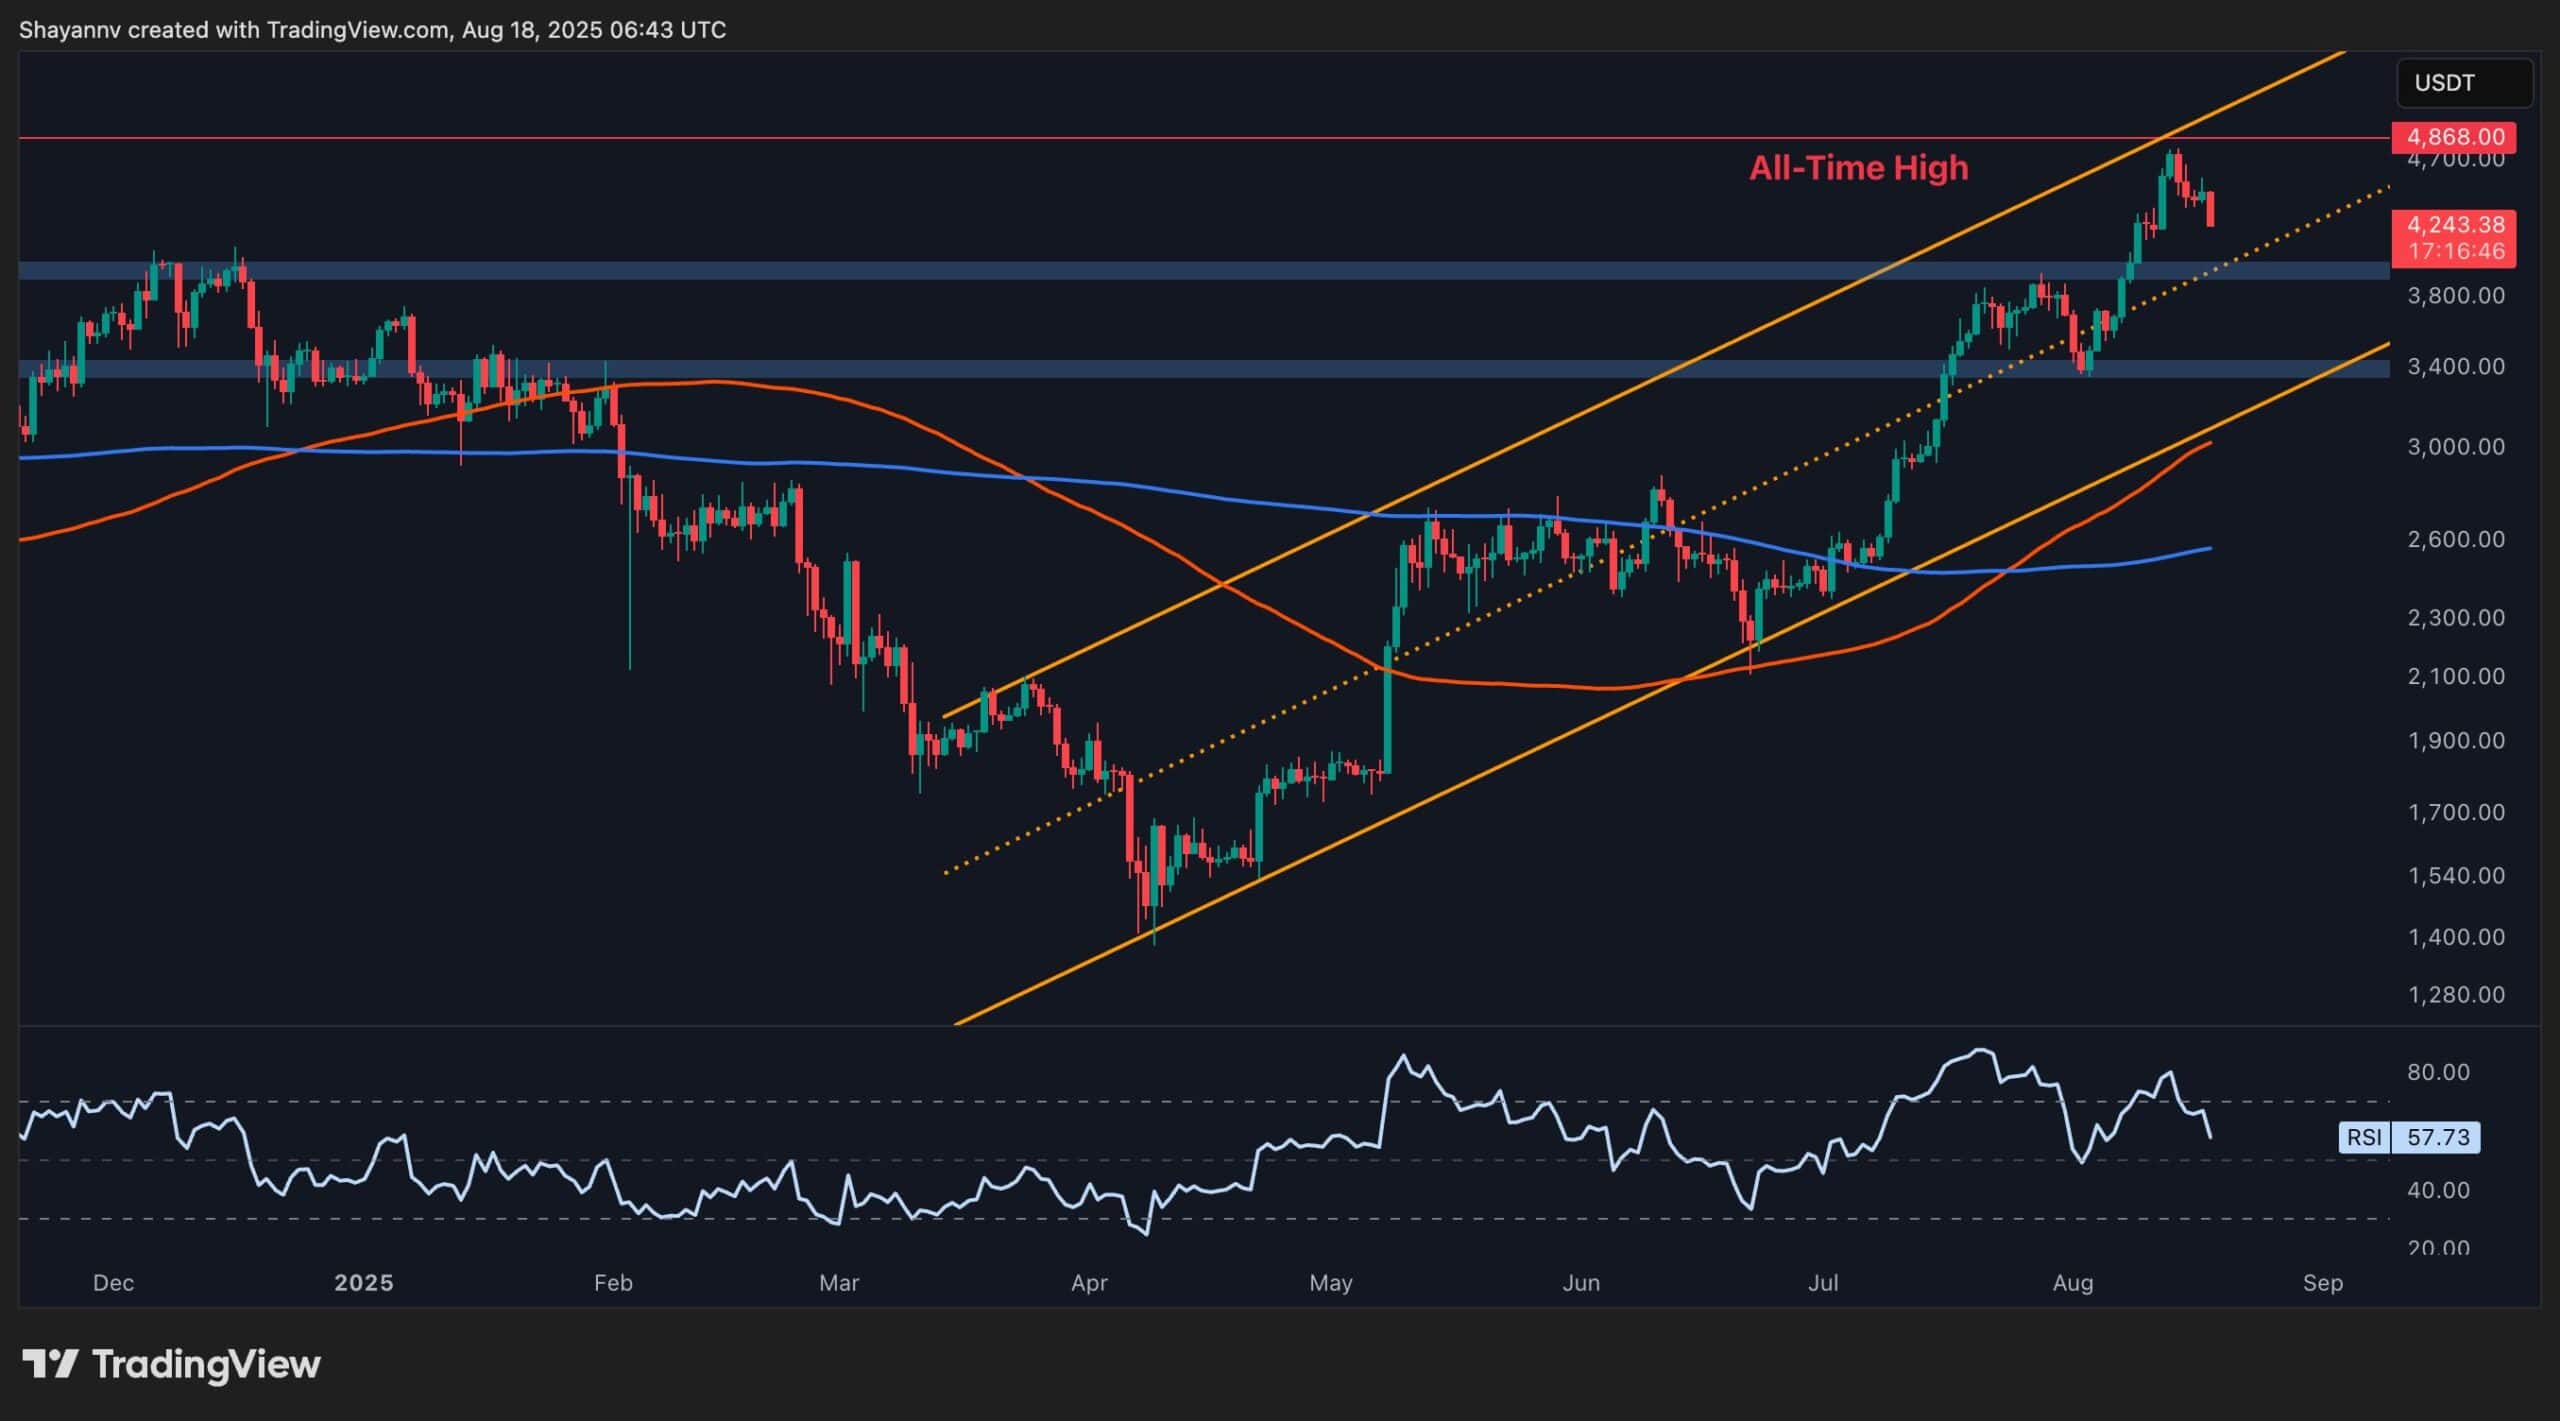
On the daily chart, Ethereum was rejected near its $4.8K all-time high, as heavy selling pressure, likely from profit-taking and unstaking, added to supply. The decline pushed price back toward a confluence of supports, including the ascending channel’s midline and the $4.2K demand zone.
As long as ETH holds above this area, the broader bullish market structure remains valid. However, a breakdown below this zone could expose $3.8K, which aligns with a prior consolidation base and would mark a deeper retracement. Meanwhile, the RSI indicator has rolled over from overbought conditions, forming a bearish divergence that reinforces the corrective tone.
The 4-Hour Chart
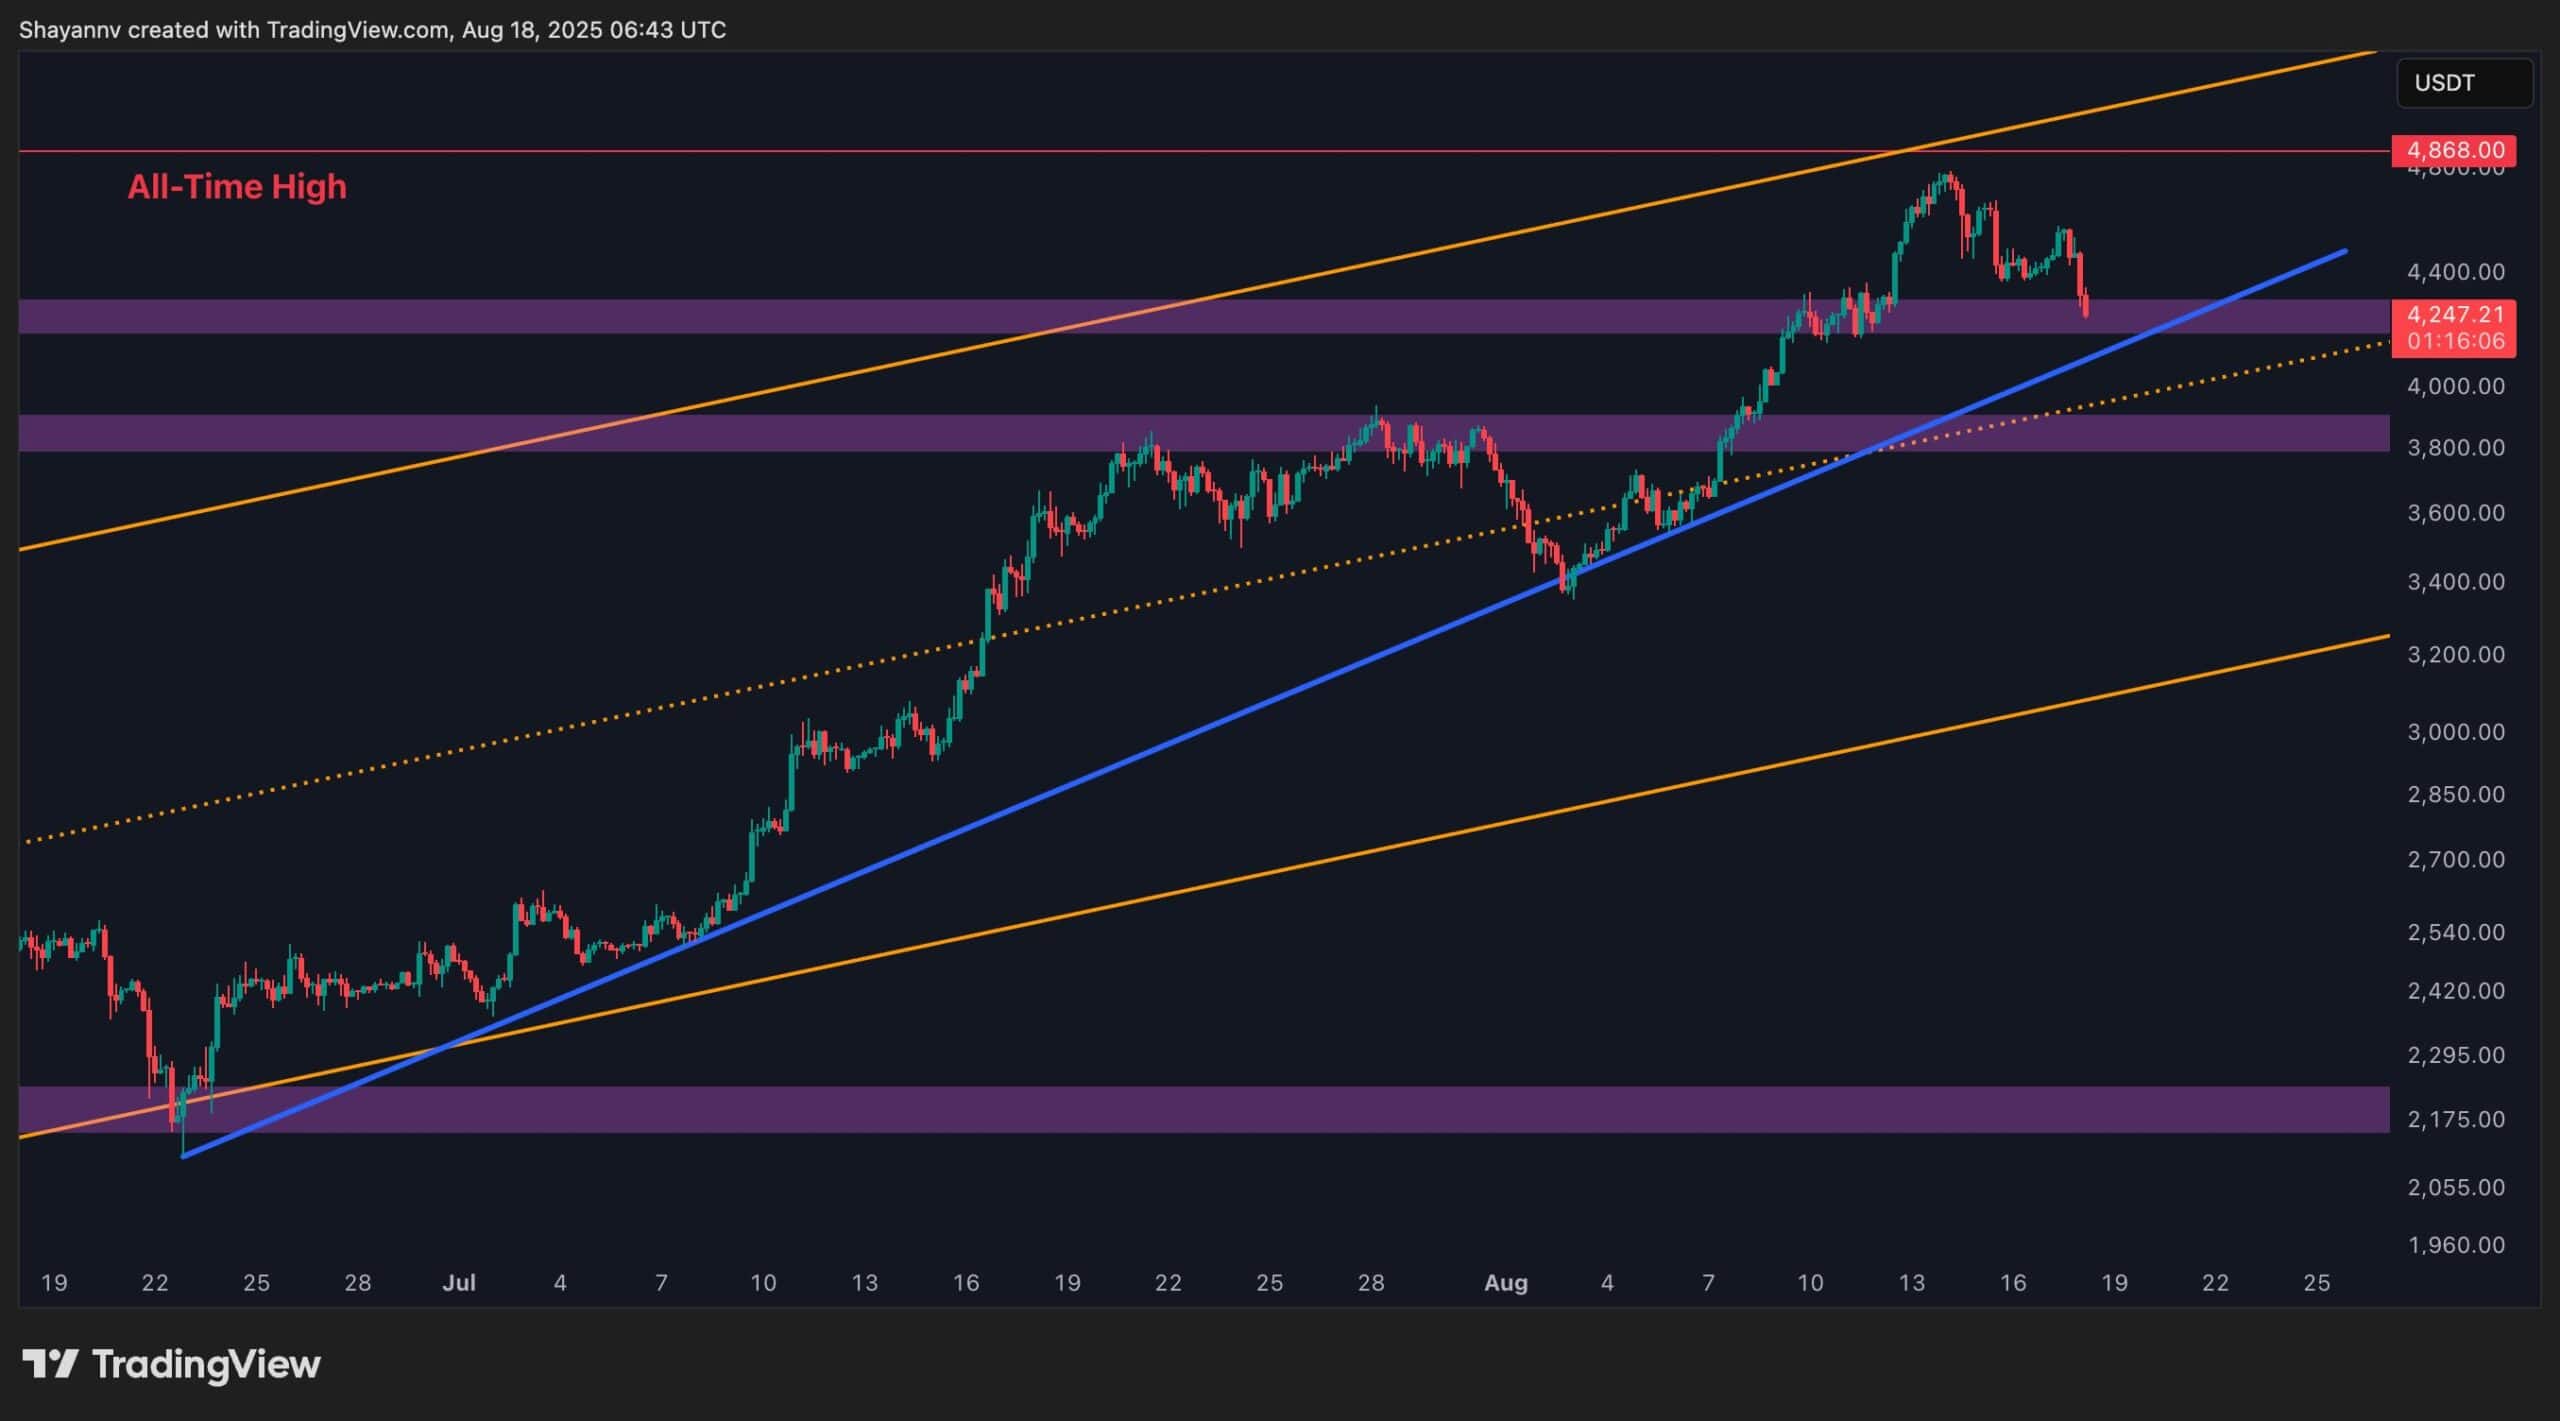
On the lower timeframe, Ethereum displayed a classic liquidity hunt as it approached the liquidity pool around the $4.8K mark, triggering stop orders and late breakout entries before reversing sharply. This rejection also broke below a recent higher low, hinting at the early stages of a market structure shift.
Currently, ETH is consolidating within a corrective phase, testing multiple support confluences. These include the $4.2K region, the ascending trendline (Blue), and, in the case of a deeper pullback, the multi-month channel’s midline near $3.8K. Until a decisive breakout occurs, ETH is likely to remain volatile, oscillating around these critical supports as the market establishes its next direction.
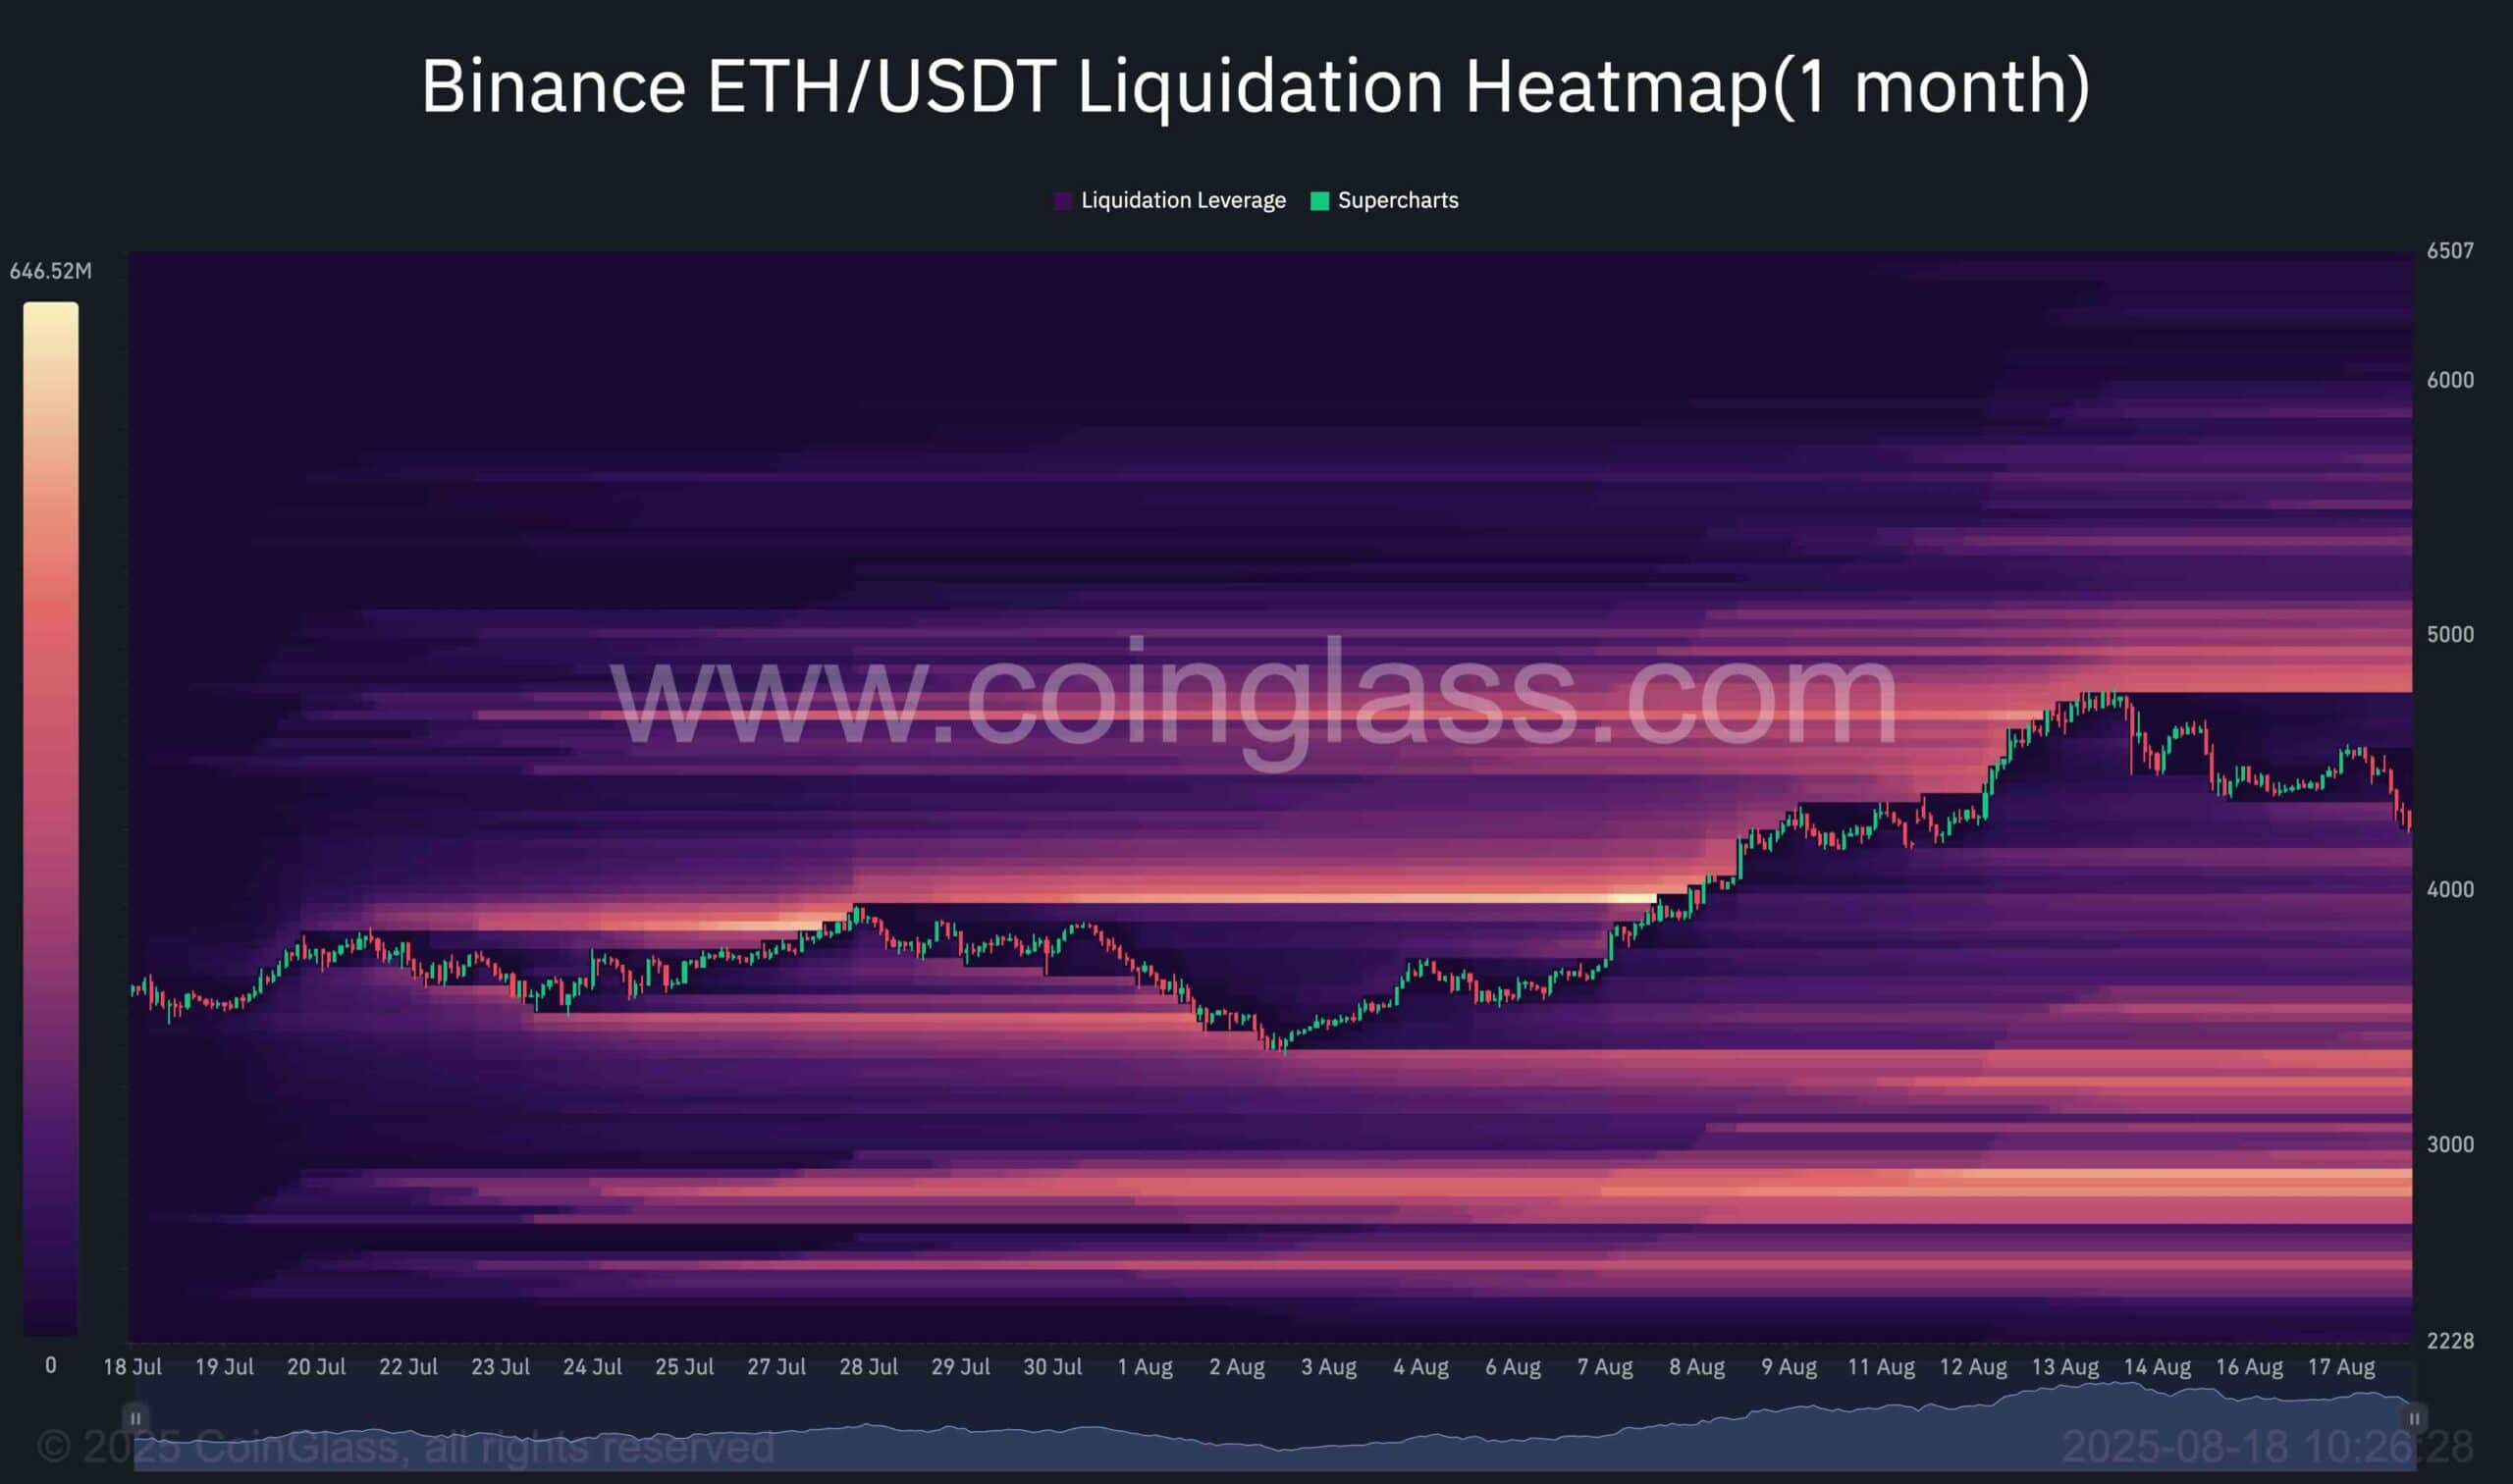
Sentiment Analysis
By Shayan
Ethereum has recently exhibited increased volatility, with the price action heavily influenced by liquidity-driven moves. The liquidation heatmap highlights where leveraged positions are concentrated, offering key levels that may attract the price in the short term.
Over the past week, ETH surged toward the $4.8K region, sweeping the liquidity pool located there before encountering strong selling pressure that triggered a sharp rejection. The retracement drove price back toward the $4K zone, which serves as a critical and psychological support.
Notably, a significant cluster of liquidation levels is now visible below the $3.8K threshold. This suggests that, in the event of a deeper correction, ETH could target this area to trigger long liquidations and capture liquidity before staging another bullish leg higher. Such levels often act as magnets for price, increasing the probability of a liquidity grab in that region.
That said, traders should remain cautious of false breakouts, as liquidity hunts on both sides of the market are likely to continue until a decisive trend structure takes hold.
Binance Free $600 (CryptoPotato Exclusive): Use this link to register a new account and receive $600 exclusive welcome offer on Binance (full details).
LIMITED OFFER for CryptoPotato readers at Bybit: Use this link to register and open a $500 FREE position on any coin!
Disclaimer: Information found on CryptoPotato is those of writers quoted. It does not represent the opinions of CryptoPotato on whether to buy, sell, or hold any investments. You are advised to conduct your own research before making any investment decisions. Use provided information at your own risk. See Disclaimer for more information.
Cryptocurrency charts by TradingView.