
Is Bitcoin About to Drop Again? BTC Tests Critical $65.5K Support Level
Price action on bitcoin‘s daily chart reflected a continuation of a broader downtrend that followed a lower high near the $76,000 region. The current zone around $66,000 to $67,000 has emerged as tentative support, but the inability to reclaim higher levels underscores persistent weakness.
A break below $65,000 would expose downside toward $62,000, while resistance remains stacked between $70,000 and $72,000, leaving bitcoin in a structurally vulnerable position despite short-term stabilization.

On the four-hour bitcoin chart, the market structure remains clearly directional, defined by a sequence of lower highs and sustained selling pressure. A sharp move down to approximately $65,500 was followed by muted consolidation, with no decisive reversal signals evident. Price continues to respect resistance in the $68,000 to $69,000 zone, suggesting that upward attempts are being absorbed. The pattern aligns more closely with continuation behavior than reversal, absent a meaningful shift in momentum or volume expansion.

The one-hour chart highlights a compression phase, with bitcoin trading between roughly $65,500 and $66,800. Candlestick bodies have narrowed, and declining volume indicates market indecision. This type of range-bound behavior often precedes a volatility expansion, though direction remains uncertain. The lack of conviction from either side reinforces the broader narrative: participants appear to be waiting for a catalyst before committing to a directional move.

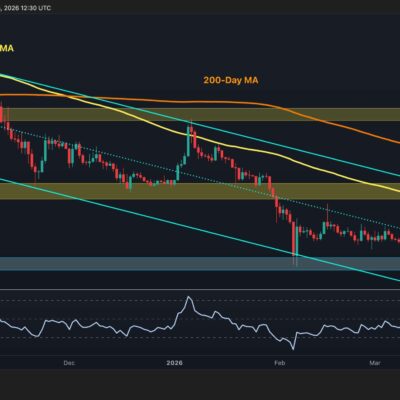
Oscillators paint a mixed but generally subdued picture. The relative strength index ( RSI) at 41 signals neutral momentum, while the Stochastic and commodity channel index (CCI) also remain in non-committal territory despite deeply negative readings in the latter.
The average directional index (ADX) at 16 indicates a weak trend environment. Meanwhile, the Awesome oscillator and moving average convergence divergence ( MACD) both reflect negative momentum, offset slightly by a positive reading in the momentum indicator, leaving the overall oscillator summary neutral but hardly encouraging.
Moving averages offer a far less ambiguous signal, with the entire structure firmly overhead. The exponential moving average (EMA) and simple moving average (SMA) across all major periods, from the 10-day through the 200-day, sit above the current price, ranging from approximately $68,923 (EMA 10) and $69,130 (SMA 10) up to $85,662 (EMA 200) and $91,308 (SMA 200). This alignment reinforces a strong downward bias in trend positioning, suggesting that any upward movement must first contend with a dense cluster of resistance levels.
Bull Verdict:
Bitcoin is holding a critical short-term support zone near $65,500–$66,000 while momentum remains neutral rather than decisively negative. A sustained move above $67,000, particularly with expanding volume, would signal a shift in short-term structure and open the path toward $68,500 and potentially $70,000, challenging the prevailing bearish trend.
Bear Verdict:
Bitcoin continues to trade below all major moving averages, with multi-timeframe structure still defined by lower highs and persistent resistance overhead. A breakdown below $65,500 would confirm continuation of the current trend, exposing downside toward $64,000 and $62,000, as weak momentum and overhead supply continue to limit upside participation.
FAQ 🔎
- What is bitcoin’s price outlook on March 28, 2026?
Bitcoin is consolidating near $66,000 with a neutral-to- bearish technical bias across key timeframes. - Why is bitcoin struggling below $70,000?
Bitcoin remains below all major moving averages, signaling strong overhead resistance and weak trend momentum. - What are the key support and resistance levels for bitcoin?
Support sits near $65,500, while resistance is concentrated between $67,000 and $70,000. - Is bitcoin likely to break out or break down next?
Current price compression suggests a pending move, with downside continuation slightly favored unless resistance breaks.