
Kaspa price appears to be on the verge of a breakout from a bullish reversal pattern ahead of its upcoming listing on crypto exchange HTX. Can it recover from its recent monthly losses?
Summary
- Kaspa price rose nearly 10% over the past day.
- KAS is set to be listed on HTX, while the community is also hyped over a rumoured Crypto.com listing.
- A falling wedge pattern formed on the weekly chart hints at a potential breakout in the upcoming trading sessions.
According to data from crypto.news, Kaspa (KAS) rose 9.5% over the past day to $0.047 last check on Monday morning, Asian time. At this price, it remains 17% above its weekly low with a market cap of $1.26 billion. However, KAS price is still 24% below its November high.
Kaspa price is gaining momentum on news of a potential listing on crypto exchange HTX, with trading for the token set to go live on the platform on Wednesday, Dec. 24.
The Kaspa community is also buzzing over rumours of a potential listing on Crypto.com, another major global crypto exchange.
Listing announcements on such major crypto exchanges tend to increase visibility and credibility for the associated cryptocurrency, which often triggers rallies at least in the short term.
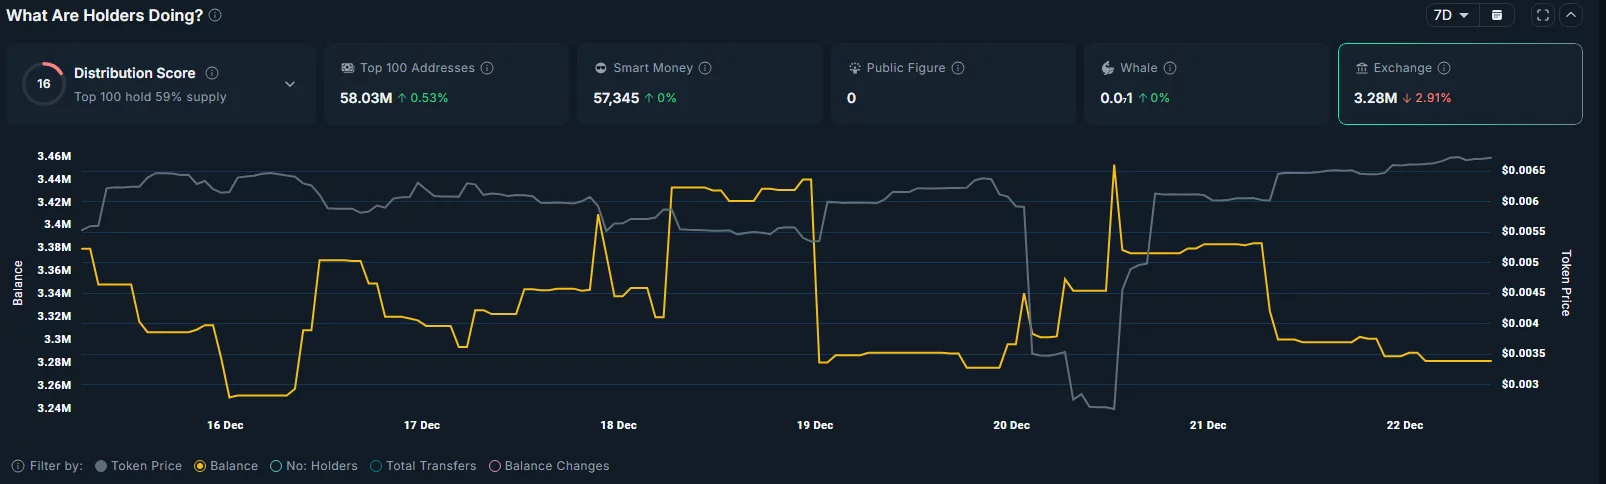
This comes as data from Nansen shows that the balance of KAS tokens on exchanges has dropped nearly 3% over the past week to 3.28 million. Usually, this means investors are moving their holdings to self-custody wallets, and that is a potentially bullish sign as it could reduce selling pressure in the short term.
On the weekly chart, Kaspa price has formed a falling wedge pattern, which typically acts as a popular bullish reversal pattern, especially when the price breaks out from the upper trendline of the pattern. At press time, KAS was close to breaking out from the upper trendline.
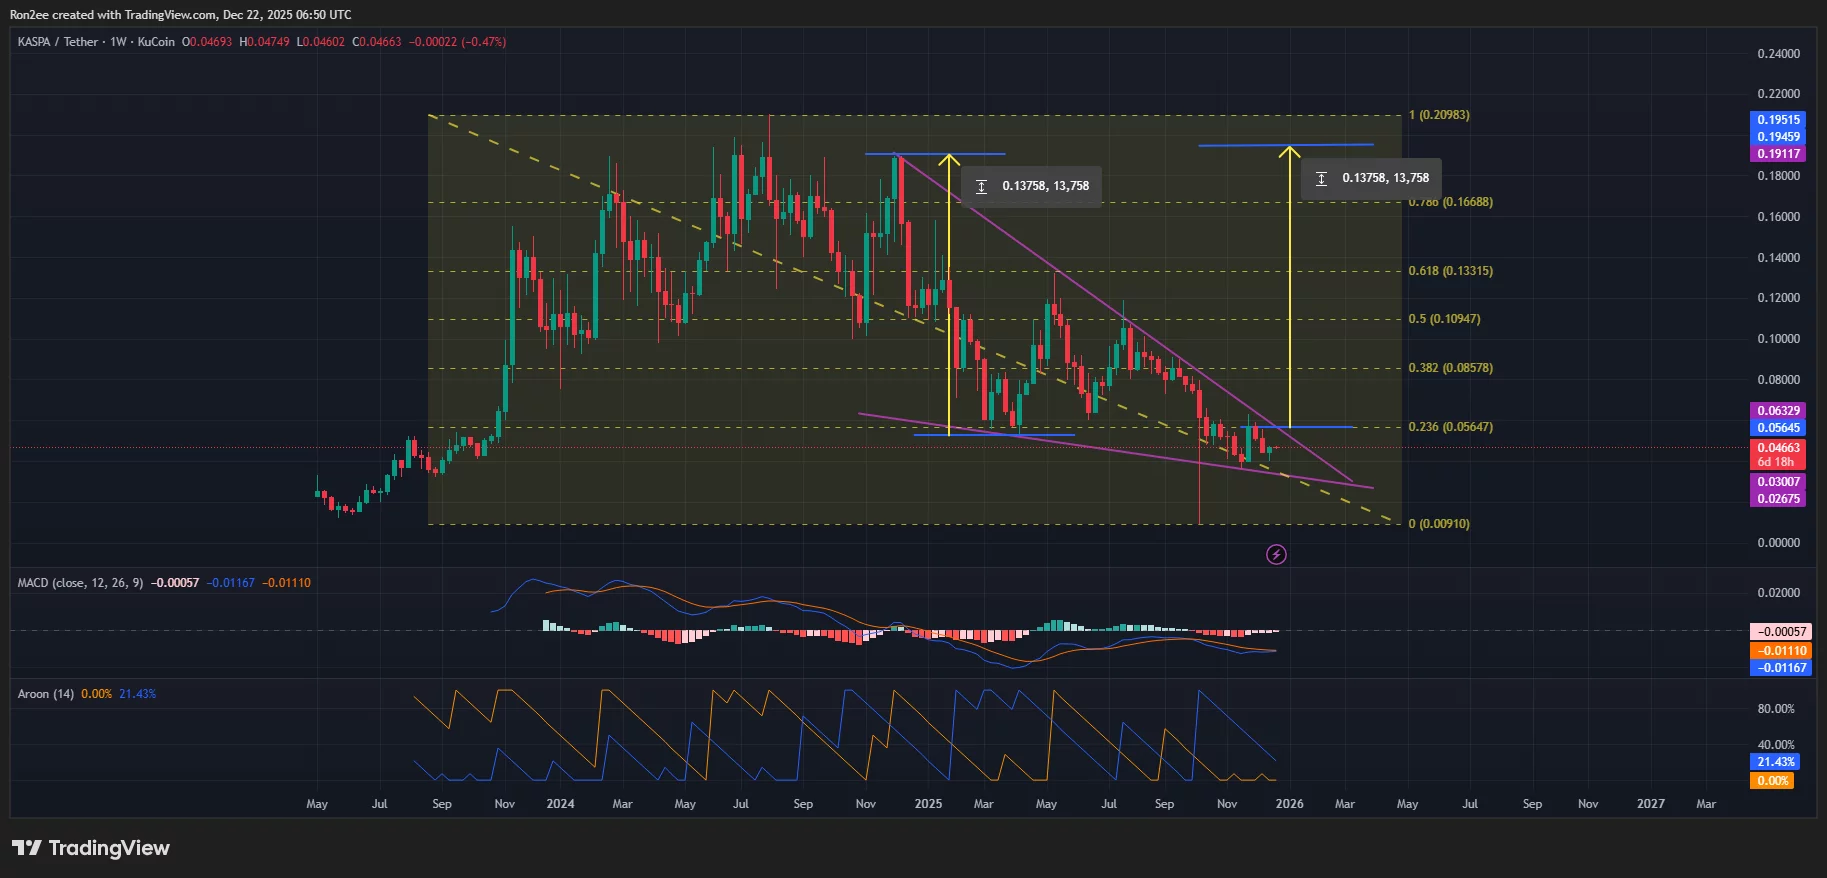
Technical indicators such as the MACD and the Aroon also displayed bullish signs. Notably, the MACD line was close to crossing over the signal line, which indicates bulls are starting to gain dominance over the bears.
At the same time, the Aroon indicator suggests a trend reversal may be on the horizon. The Aroon Down showed a reading of 21.43%, which means that while bears are still somewhat in control, their strength is diminishing, and the current downtrend is losing steam.
Meanwhile, the Aroon up was at 0%. The low readings for both indicators often signal that the market is entering a period of consolidation, or that the current trend is pausing. It may precede a potential trend reversal if the Aroon Up line were to cross above the Aroon Down once KAS gets listed on HTX.
For now, $0.056 stands as the immediate resistance level for Kaspa price, a breakout above which could push it to $0.085, which aligns with the 38.2% Fibonacci retracement level. At press time, the target lies around 80% above the current price.
Disclosure: This article does not represent investment advice. The content and materials featured on this page are for educational purposes only.