


Key Takeaways
- Bitcoin’s price rebounded from $77,603 and traded above $79,000 on Sept. 9.
- Bitcoin’s daily gauge showed 16 bullish readings, nine neutral signals and one bearish reading.
- Bitcoin must confront $79,742, while $77,603 remains the key downside risk level.
Bitcoin’s Hourly Chart Shows Buyers Absorbing the $77,603 Flush
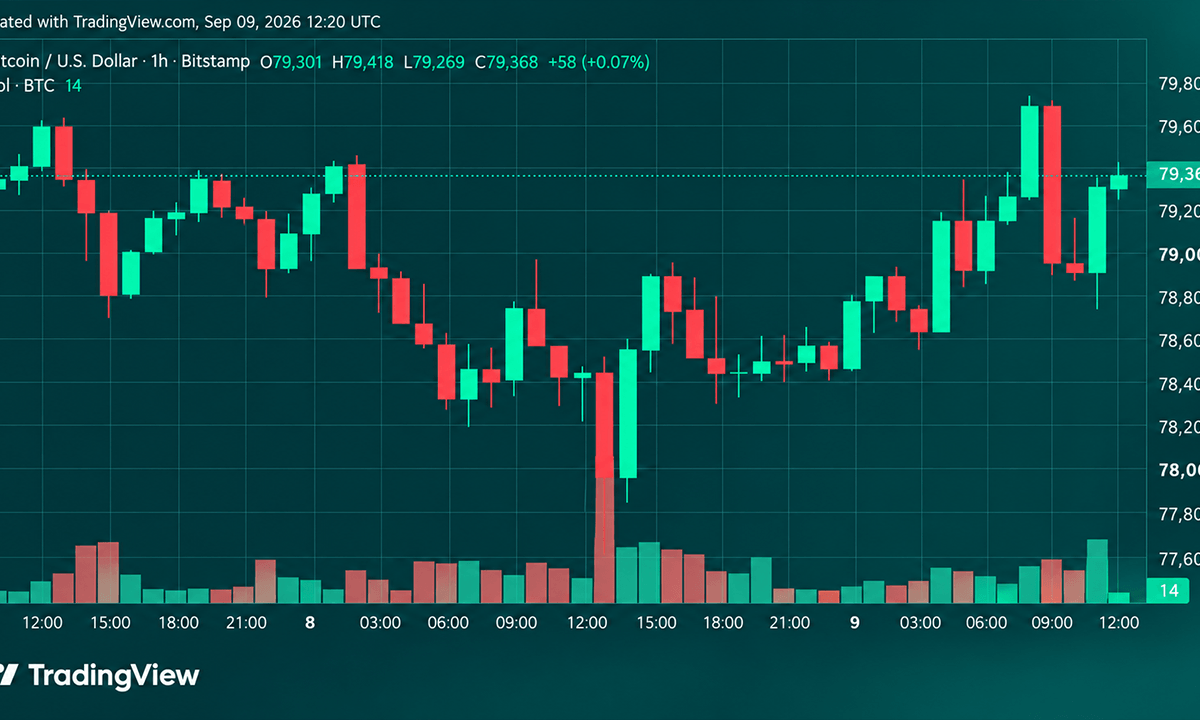
Bitcoin’s price on the 1-hour Bitstamp BTC/USD chart shows a story that starts with a wild ride from Sept. 8 into Sept. 9. Bitcoin chopped sideways before a large downtrend move sent it to $77,603, and that drop coincided with the largest volume bar visible since Sept. 7. During the overnight and morning session, buyers immediately stepped in, pushing BTC to $79,742 before a pullback toward $78,800 to $79,000. Price then bounced through roughly $79,200 to $79,320.
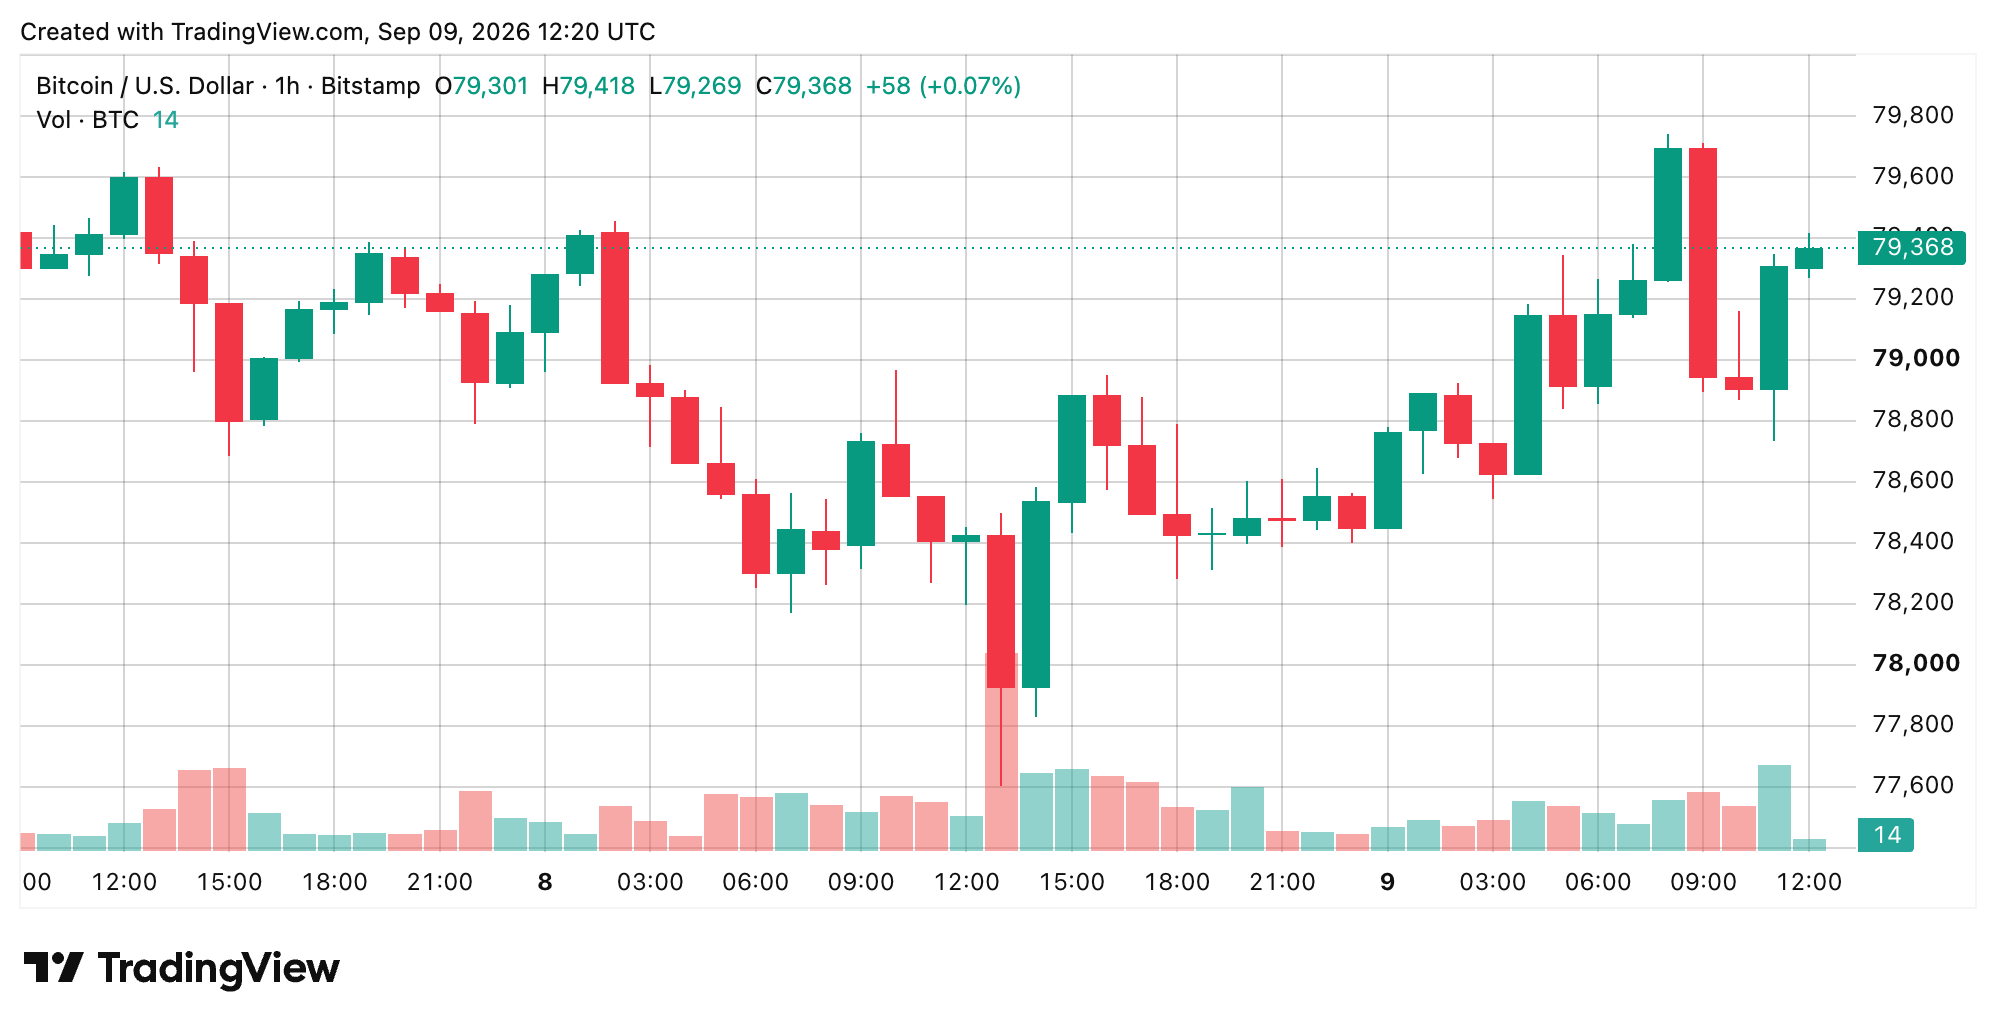
That leaves the hourly chart walking a tightrope around several clearly defined levels. Bids were stacked below the last price through $79,000, while a visible ask wall began near $79,500 and thickened above it. Local support sits at $79,000 and then $78,800, while $79,500 and $79,742 form immediate resistance. A revisit or break of $77,603 would invalidate the observed bounce structure.
Four-Hour Recovery Stalls Beneath the $79,700 to $80,000 Barrier
Bitcoin’s price via the 4-hour view turns that volatility into a clearer V-shaped recovery. Bitcoin initially traded in a roughly $78,500 to $79,500 range before breaking to $77,603 on the volume spike. The candle recovered well off that low, and subsequent trading carried BTC to $79,742. The current block then rejected that high, held around $79,000, and returned to approximately $79,200 to $79,320.
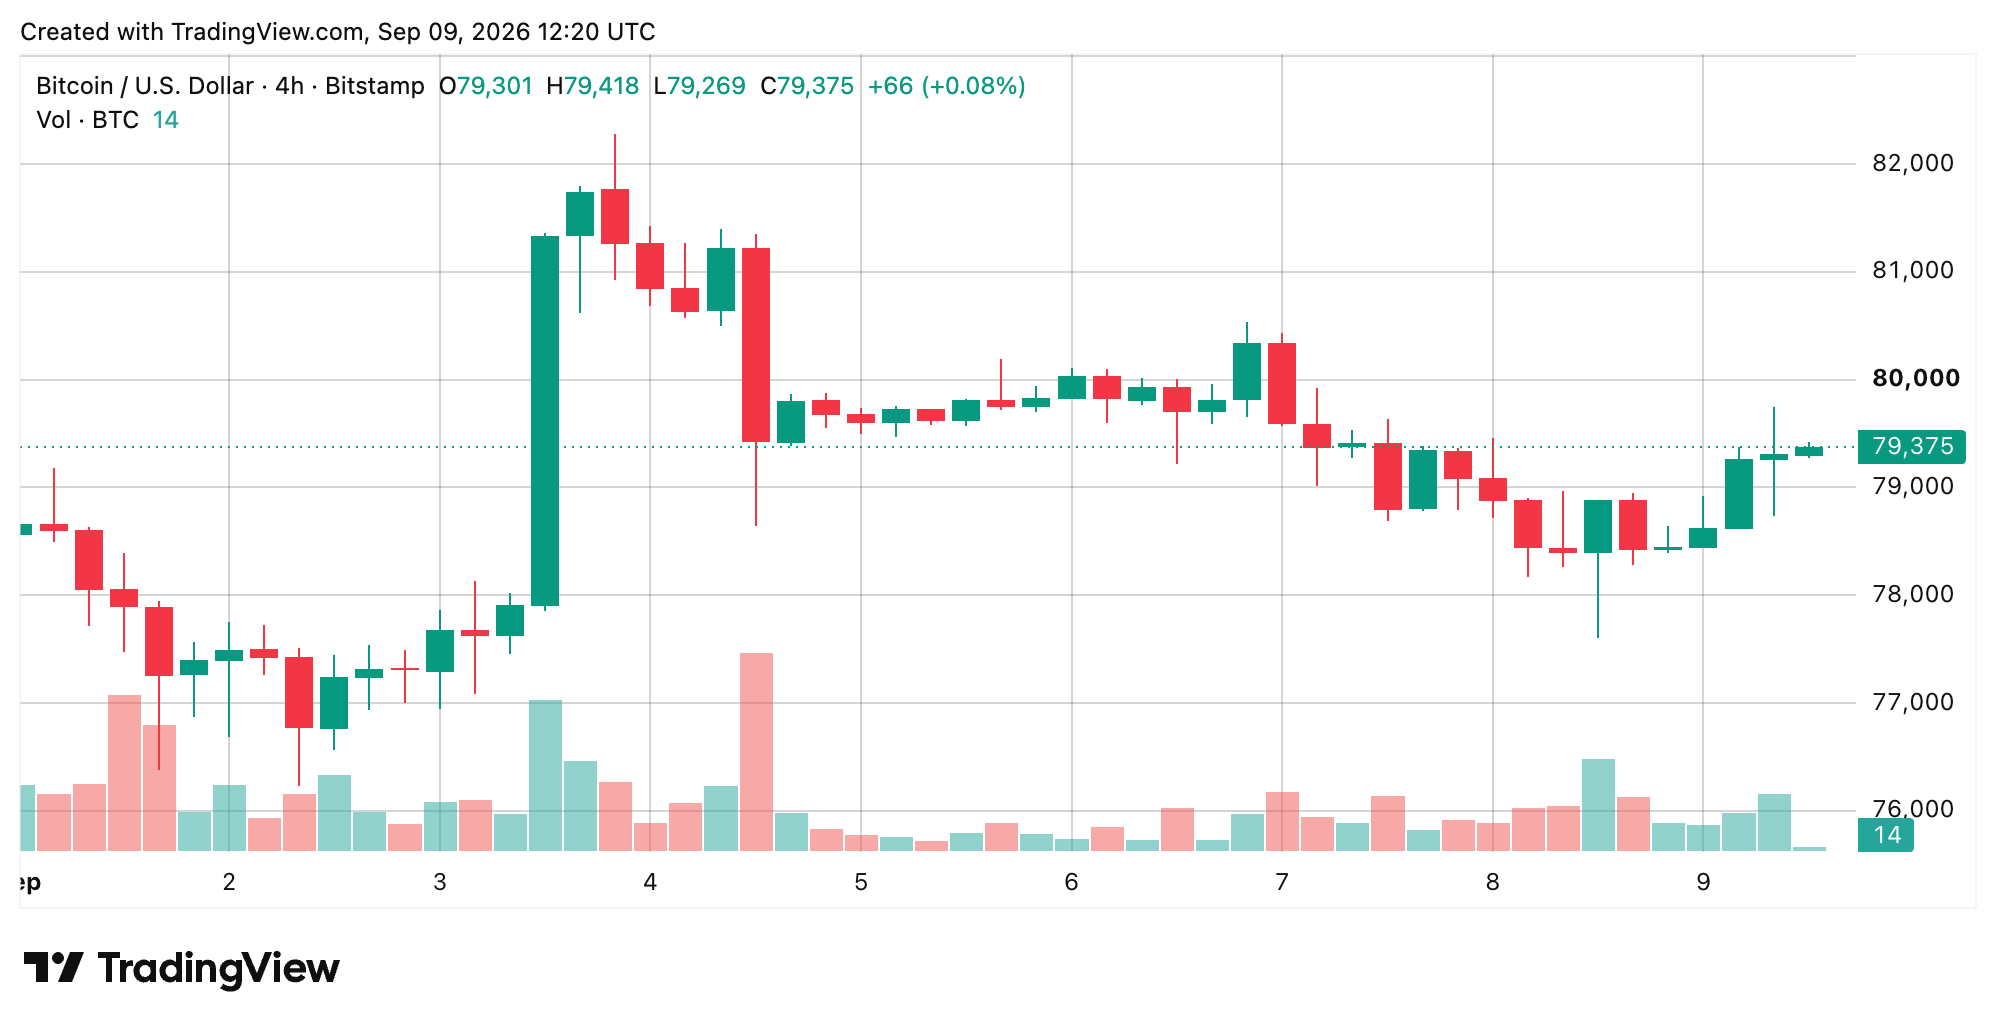
The next move hinges on either side of that range. A 4-hour close below $79,000 would put the recovery at risk and raise the prospect of another test near $77,600. On the flip side, a 4-hour close through $79,742 would provide the first evidence that the post-flush recovery is extending instead of running out of steam underneath resistance.
Bitcoin Remains Inside Its One-Week Range Despite the Recovery
Zooming out to the daily chart shows why the rebound has not yet changed the bigger picture. Bitcoin’s price reached roughly $82,200 to $82,300 on Sept. 3 before failing, then produced lower highs from Sept. 4 through Sept. 7. The Sept. 8 decline reached roughly $77,620 to $77,666 before recovering above $78,400. Sept. 9 trading subsequently returned to the $79,100 to $79,320 region.
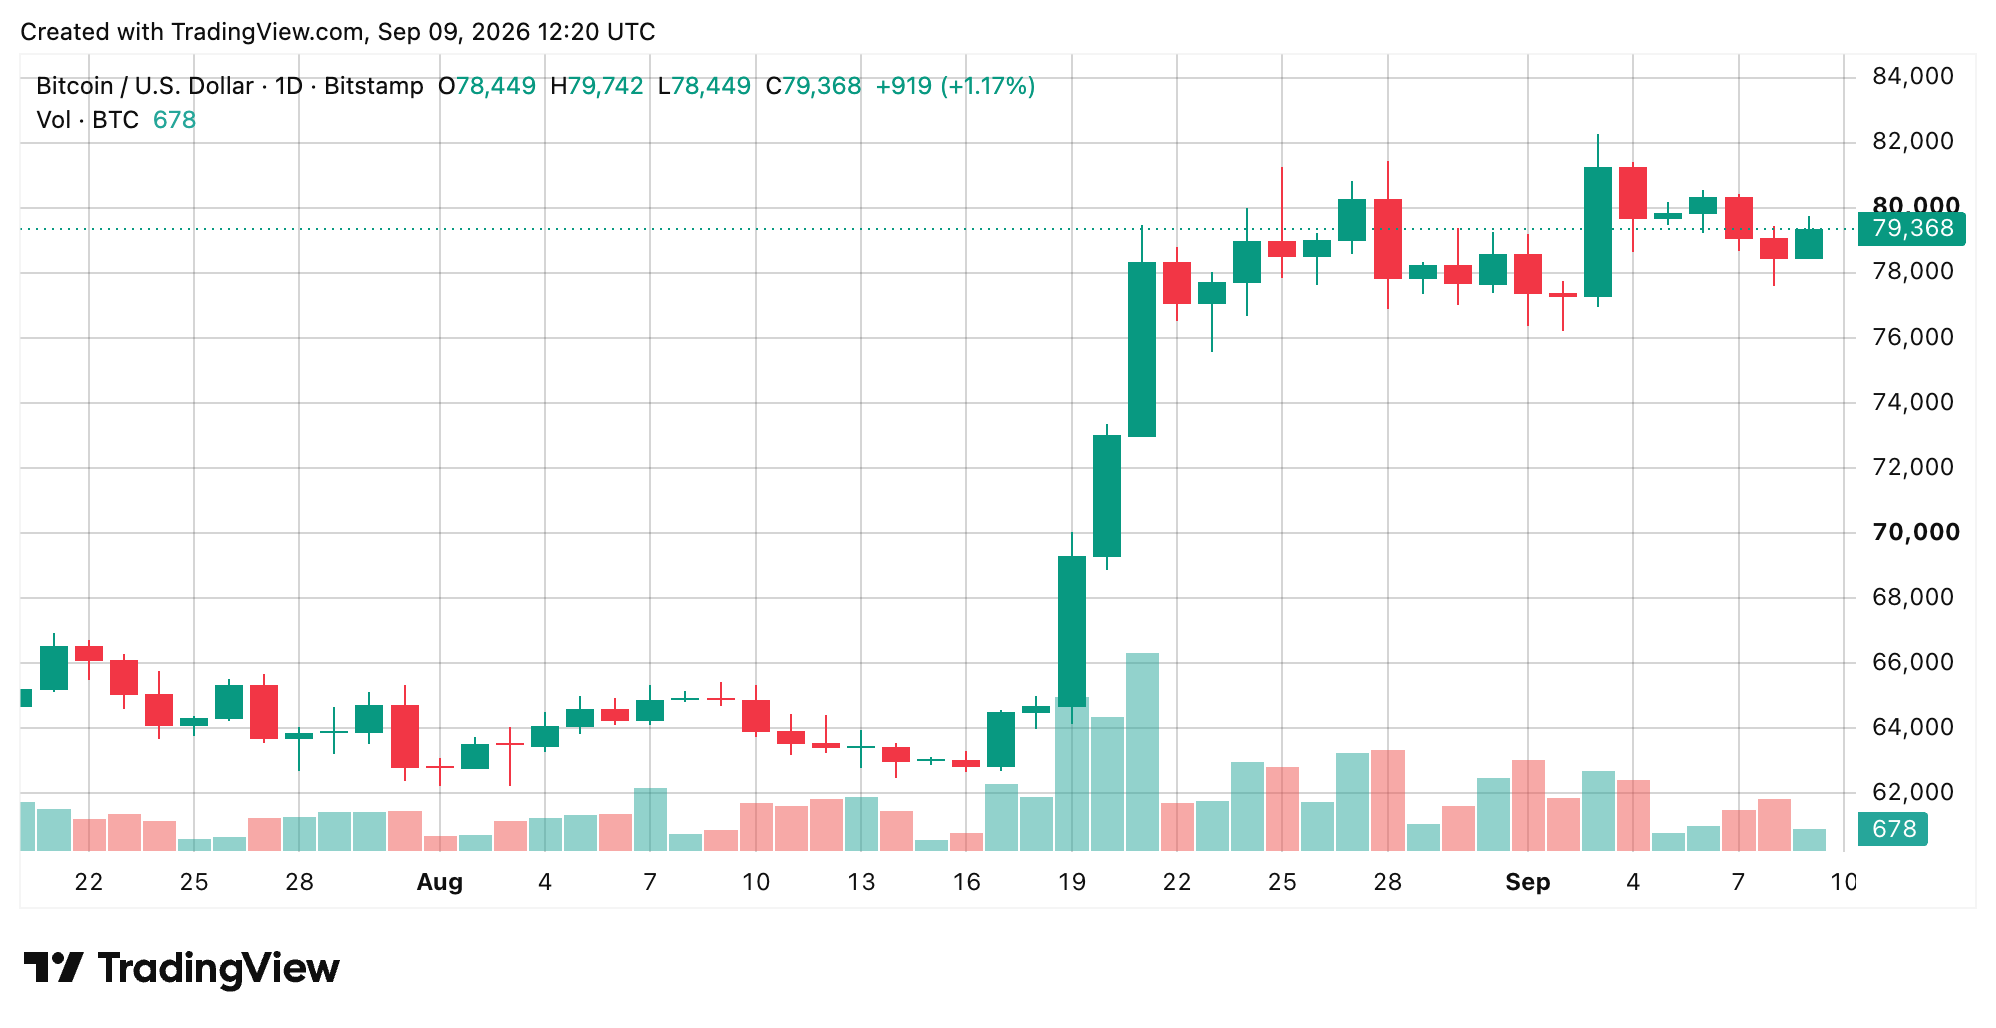
Bitcoin, therefore, remains on a recovery day inside a roughly $77,600 to $82,300 one-week range. Market data at 8 a.m. EDT placed BTC at $79,107, up 0.9% over 24 hours, with a $1.588 trillion market capitalization and a $77,666 to $79,701 intraday range. Resistance remains at $79,700 to $79,750, followed by $80,500 to $80,600 and $82,200 to $82,300.
Oscillators Show Momentum Is Mixed Rather Than Overheated
The daily chart’s oscillators are all over the place compared with the moving averages (MAs), producing eight neutral readings, two bullish and one bearish. The relative strength index (RSI) was 63, while Stochastic was 46, commodity channel index (CCI) was 45, and average directional index (ADX) was 47, all rated neutral. The Awesome oscillator (AO) was 6,522 and also neutral on Wednesday morning.
Momentum was 1,747, and bull bear power (BBP) was 1,207, both rated bullish. Moving average convergence divergence (MACD) level was 2,708 and stood alone with a negative rating. Stochastic RSI Fast stood at 4, Williams percent range was minus 47, and Ultimate oscillator (UO) was 59, with all three readings standing neutral.
Daily Moving Averages Keep the Bullish Trend Case Alive
Moving averages (MAs) provide the strongest bullish evidence on Wednesday’s tape. The daily gauge registered 14 bullish readings, one neutral, and zero bearish signals. The Exponential moving averages (EMAs) for 10, 20, 30, 50, 100, and 200 periods stood at $78,931, $77,138, $75,215, $72,563, $70,564 and $72,830, respectively. The corresponding simple moving averages (SMAs) were $79,136, $78,753, $74,191, $70,215, $66,654 and $69,927, all rated bullish.
The volume weighted moving average (VWMA) was $78,687, and the Hull moving average (HMA) was $79,135, also rated buy, while the Ichimoku Base Line was neutral at $72,467 today. The combined daily technical gauge stands strong, with 16 positive, nine neutral readings, and one negative. Still, the dust has not settled: $79,742 and then $80,500 remain the levels to clear, while $77,603 to $77,666 remains the factual risk line beneath the bounce.
Bull Verdict
Bulls stay in the driver’s seat while Bitcoin holds $79,000, but $79,742 is the line that matters. A 4-hour close through that resistance would strengthen the post-$77,603 recovery and put the next resistance zone at $80,500 to $80,600 in play.
Bear Verdict
Bears get their opening if Bitcoin loses $79,000 and the recovery starts running out of steam. A breakdown would put the $77,603 to $77,666 support zone back in focus, while a break beneath that floor would invalidate the immediate bounce structure.