


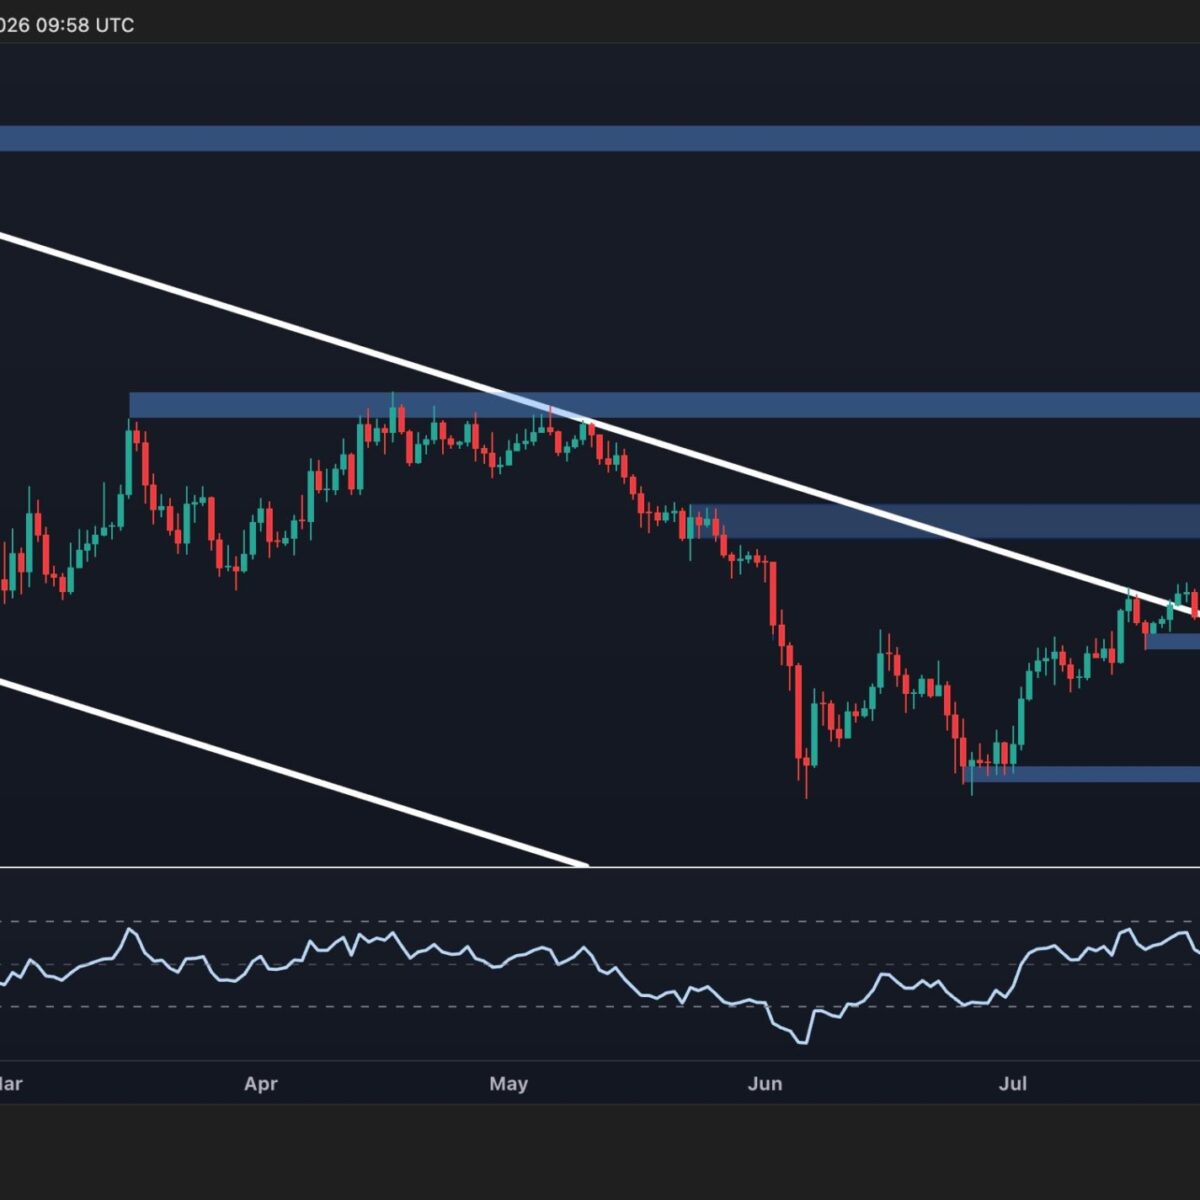
Ethereum has staged a sharp breakout from its multi-week consolidation, with ETH now trading around $2.4K after reclaiming the descending trendline that had capped the broader recovery. The move is supported by a strong acceleration in momentum and a noticeable rise in short liquidations, although the sharp increase in RSI readings suggests the rally could become vulnerable to a near-term pullback.
Ethereum Price Analysis: The Daily Chart
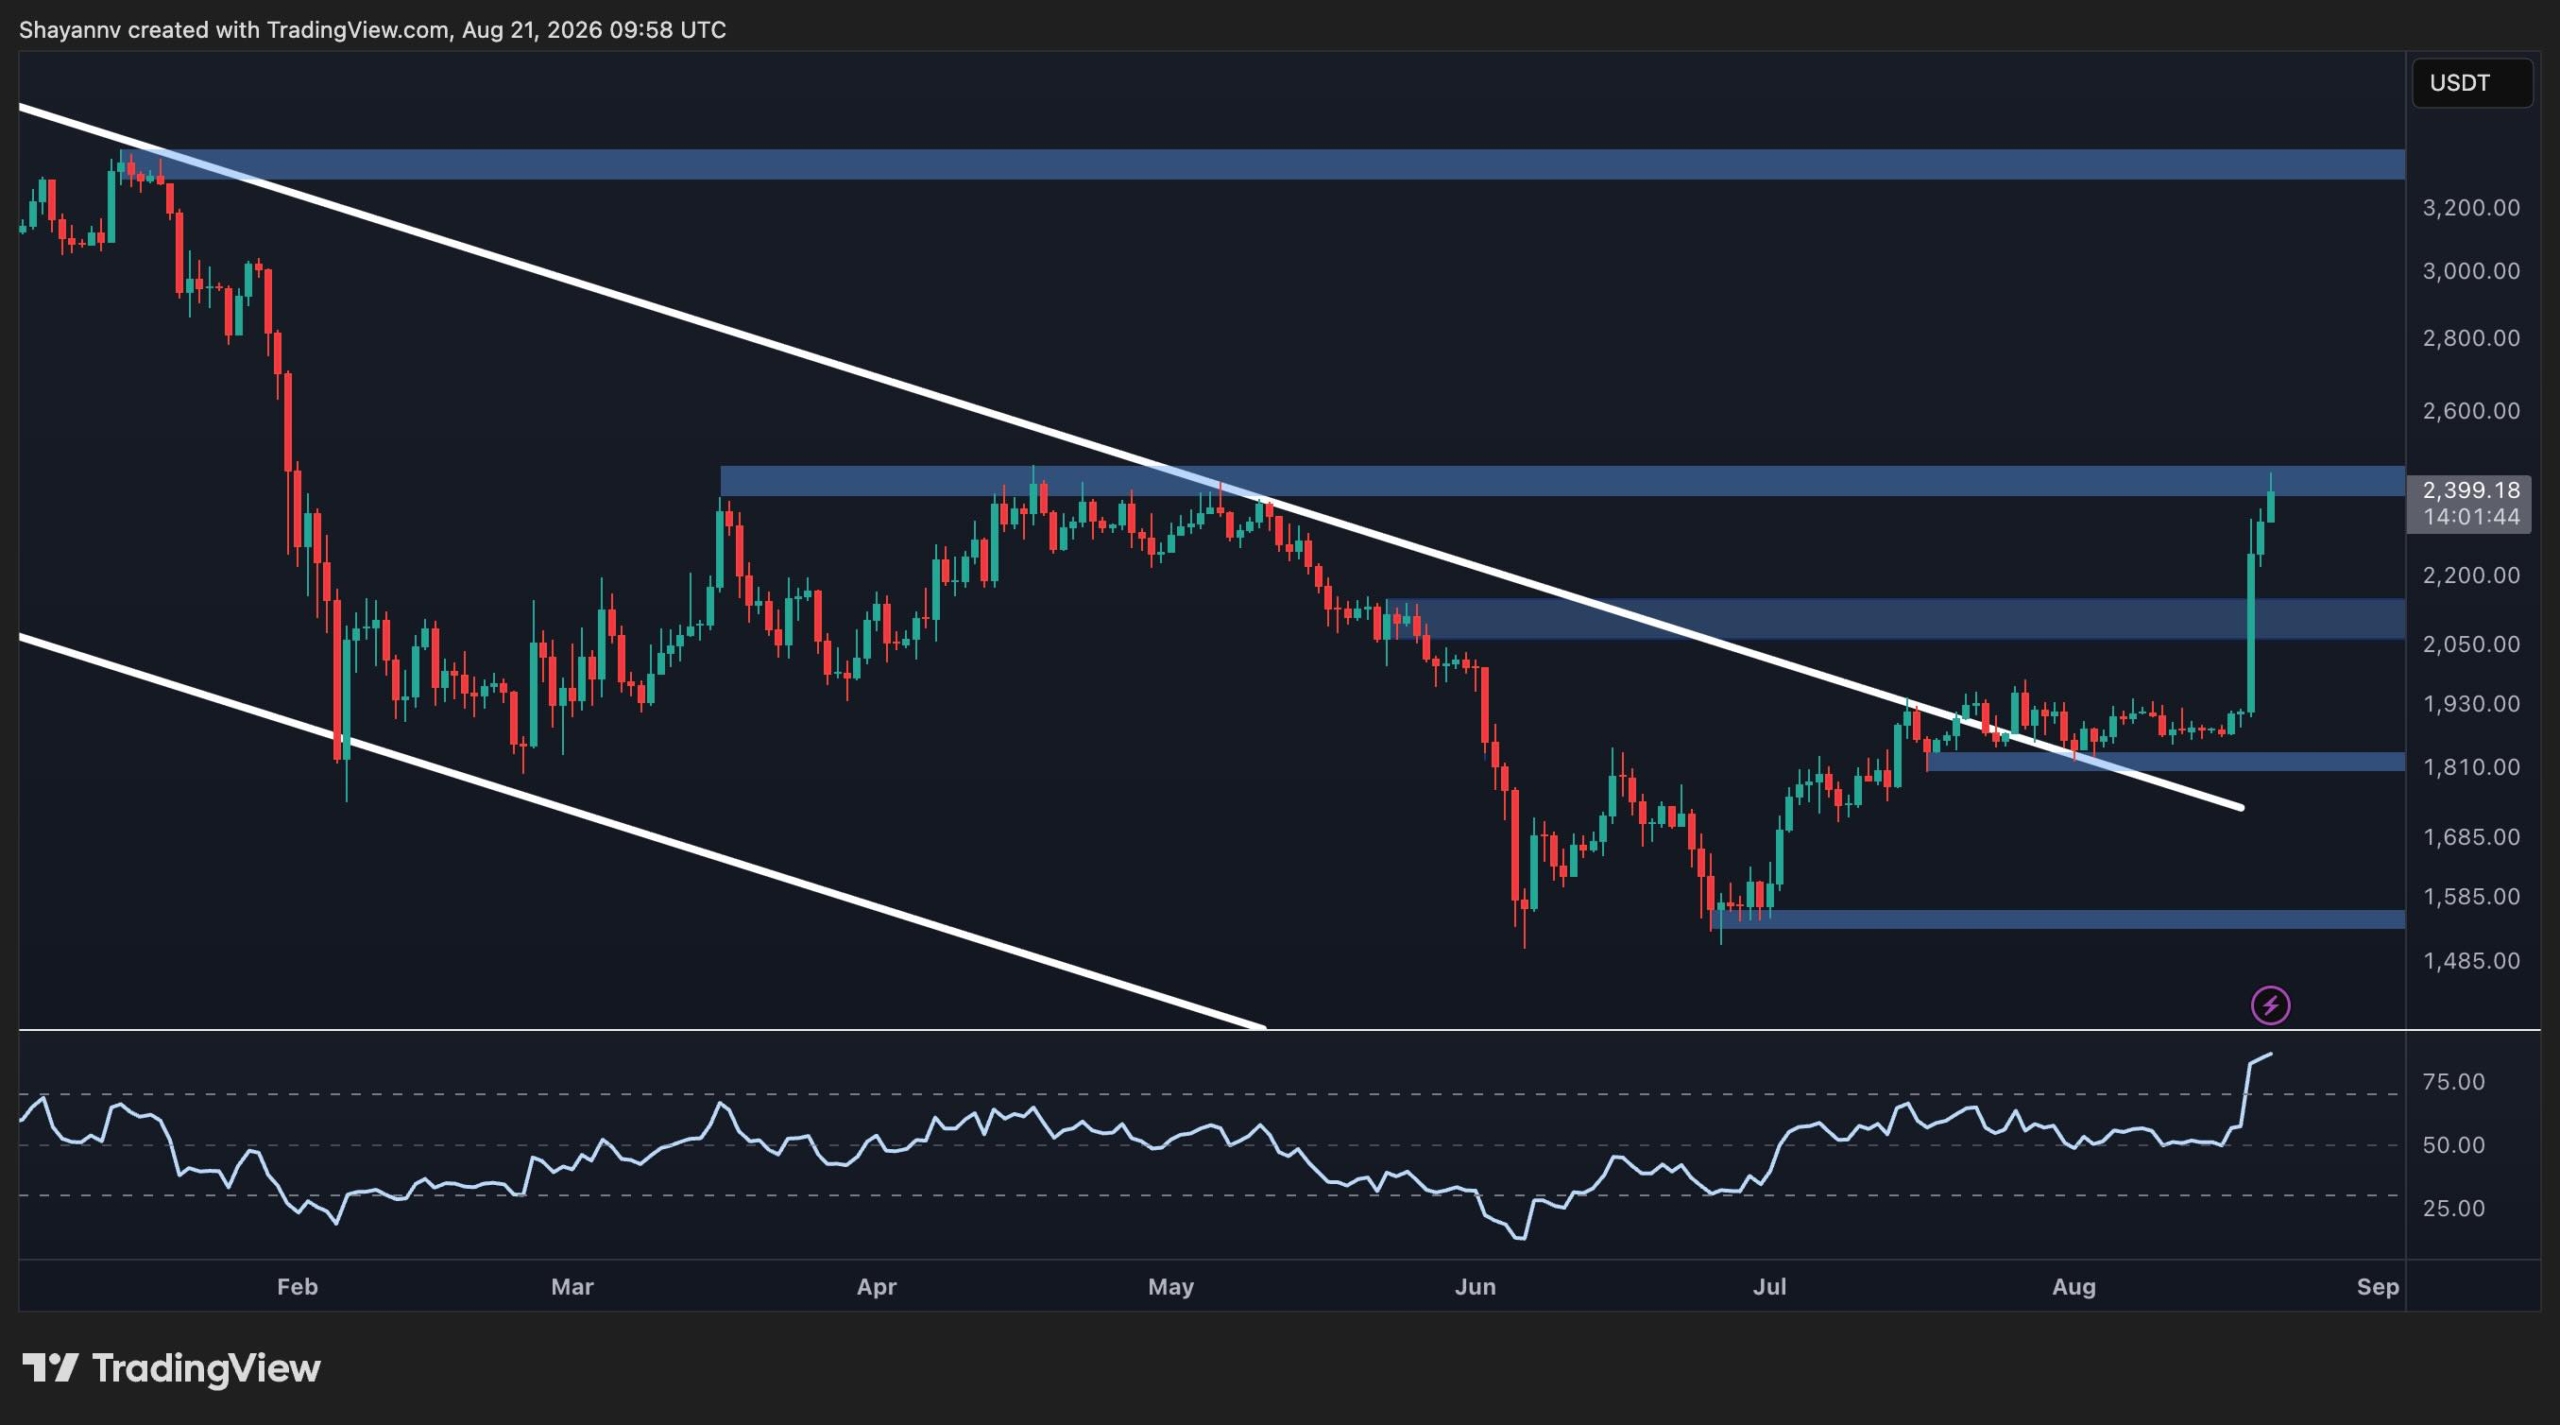
On the daily chart, ETH has decisively broken above the descending trendline that had been in place for months. The breakout is particularly significant because the price had spent several months consolidating below that resistance while forming higher lows from the June bottom near $1.5K.
The latest surge has carried ETH directly into the $2.1k resistance level, with the price currently testing the $2.4K supply zone. This area represents the immediate test for the breakout. A sustained daily close above the zone would strengthen the bullish structure and could open the way toward $3K and potentially higher.
On the downside, the former breakout area around $2.1K is now the first major support zone. Holding above it would keep the recent breakout structure intact. Below that, the $1.8K region represents another important support area, while the $1.5K zone remains the deeper structural floor.
Momentum has also shifted sharply in favor of the buyers. The daily RSI has jumped above 75, running deep into the overbought area. This does not necessarily invalidate the breakout, particularly during a strong expansion move, but it does increase the probability of consolidation or a retest before another sustained leg higher.
ETH/USDT 4-Hour Chart
The 4-hour chart provides an even clearer picture of the breakout. ETH spent much of the last few months moving sideways before suddenly breaking above the short-term mildly ascending channel and the $2.1K resistance zone.
The breakout was followed by an almost vertical advance toward $2.4K, indicating strong short-term momentum. The $2.1K zone is therefore the key area to watch if the rally starts to retrace. A successful retest of this region as support would provide a healthier confirmation of the breakout.
As observed on the daily chart, the next major resistance sits around $2.4K, where ETH is currently trading. A decisive move above this zone could extend the advance toward higher levels in the upcoming weeks. At the same time, the 4-hour RSI has surged far above 80 and is moving sideways in this region.
That reading highlights just how stretched the immediate move has become. A pullback toward $2.1K would therefore not necessarily be bearish and would likely be necessary for the market to cool down, provided ETH maintains the breakout zone.

Sentiment Analysis
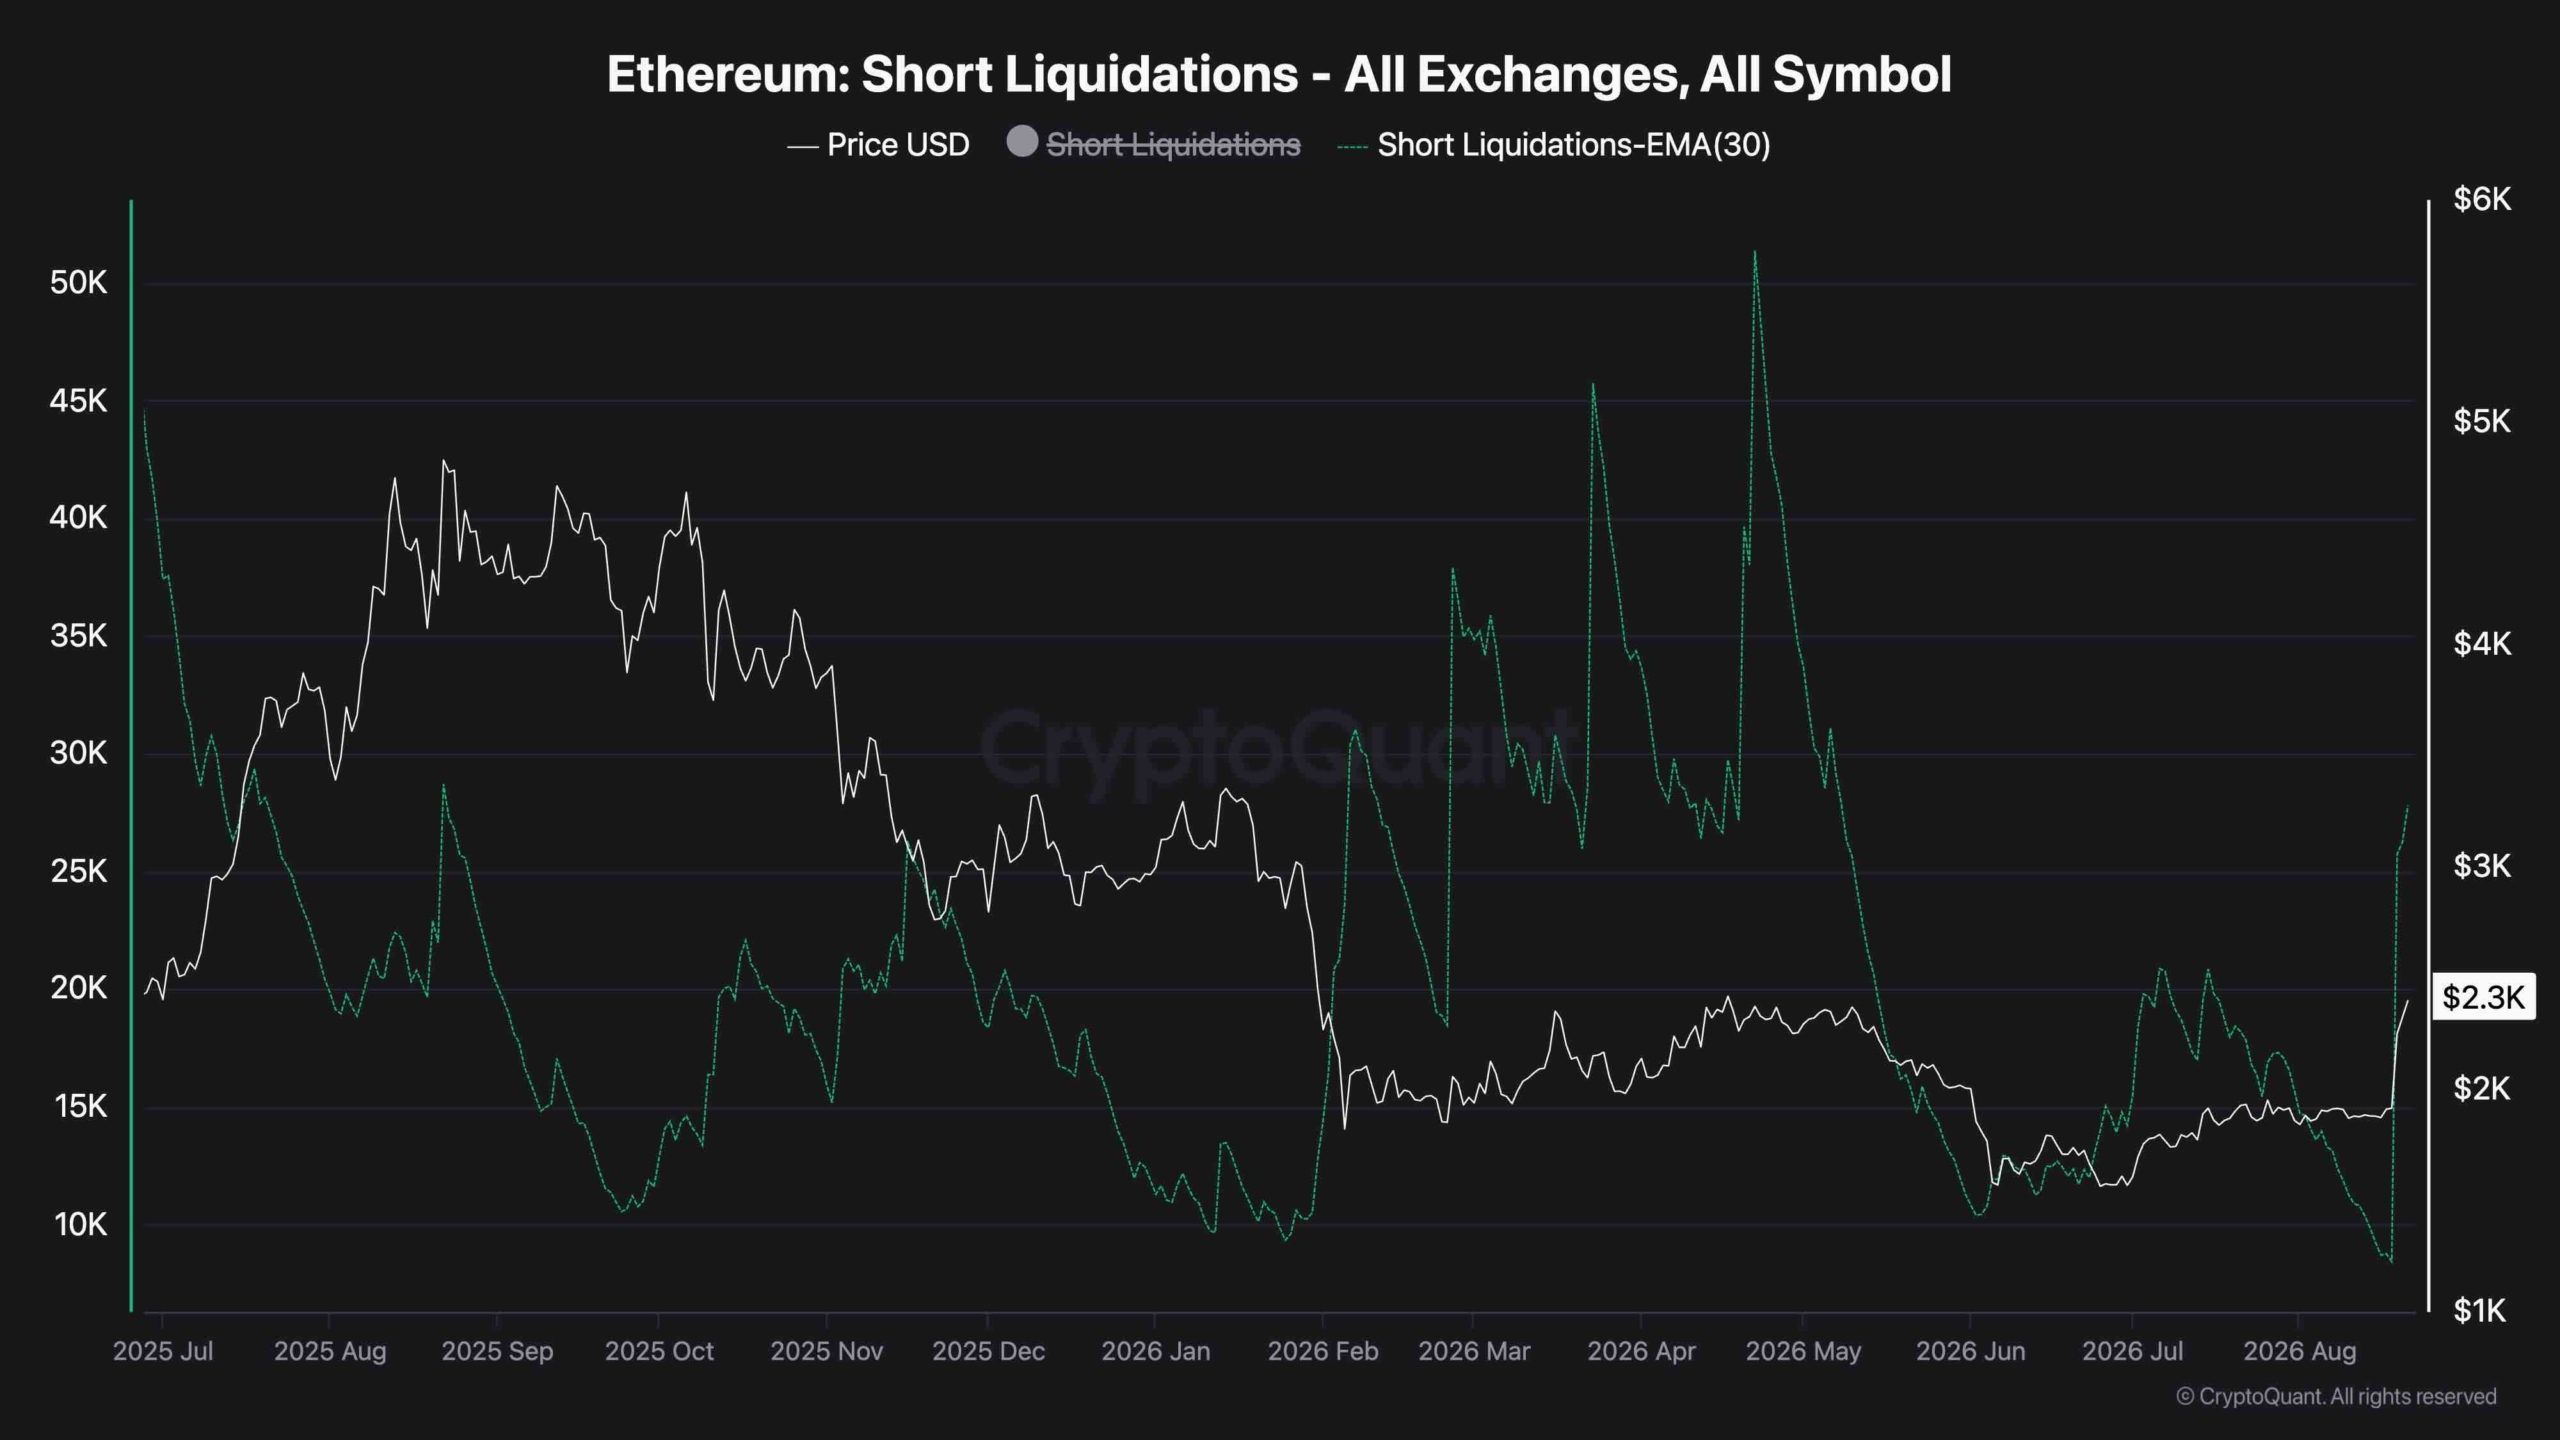
The liquidation chart shows a clear increase in Ethereum short liquidations alongside the latest price surge. Short liquidations have risen sharply toward roughly 28K on the latest spike, following a period in which the metric had remained comparatively subdued.
This suggests that the move above $2K has forced a growing number of bearish positions to close, adding forced buying pressure to the rally. In other words, the breakout appears to have developed a short-squeeze component.
However, the latest liquidation spike is still below several of the much larger liquidation events visible earlier in the chart, including episodes above 40K and 50K. That indicates the current squeeze has been significant but has not yet reached the most extreme levels seen during previous Ethereum rallies.
Overall, the charts favor a bullish interpretation as long as ETH holds the newly reclaimed $2K-$2.1K area. The immediate challenge is whether buyers can sustain momentum above the $2.4J resistance zone. With both the daily and 4-hour RSI heavily overbought and short liquidations accelerating, a temporary cooldown would be unsurprising, but the breakout structure remains constructive unless ETH loses its key support zones.
Disclaimer: Information found on CryptoPotato is those of writers quoted. It does not represent the opinions of CryptoPotato on whether to buy, sell, or hold any investments. You are advised to conduct your own research before making any investment decisions. Use provided information at your own risk. See Disclaimer for more information.