



Solana price has fallen toward $70 on November 16, extending its seven-week decline as continued ETF withdrawals and weakness across the cryptocurrency market keep pressure on SOL.
Summary
- Solana price dropped toward $70 after losing nearly 17% over the past seven days alone.
- U.S. spot Solana ETFs recorded roughly $32 million in withdrawals during their sixth consecutive outflow week.
- SOL has recorded seven consecutive lower weekly closes, falling 40.4% from its late-September closing level.
- Solana’s daily RSI near 20 indicates oversold conditions, although bearish momentum remains firmly in place.
- Traders are monitoring $70 support, with further downside levels near $68, $65 and eventually $60.
According to crypto.news market data, Solana traded at $70.80 on Monday, down 2.61% over 24 hours and 16.84% over the past seven days. The cryptocurrency has lost 31.87% over the past month after falling from its late-September levels above $120.
SOL dropped to $67.41 over the weekend, its lowest level since late June, before recovering above $70. The decline coincides with six consecutive weeks of net withdrawals from U.S. spot Solana exchange-traded funds, while Bitcoin’s latest selloff has weighed on the broader market.
Solana ETF outflows extend to six consecutive weeks
Institutional demand through U.S.-listed Solana ETFs has weakened since October, with investors continuing to withdraw capital from the products.
Data from Farside Investors showed that spot Solana ETFs recorded roughly $32.05 million in net outflows during the week ending November 13, extending their losing streak to six consecutive weeks.
The withdrawals have reached approximately $197.4 million over the six-week period, following a previous run of 14 consecutive weeks of net inflows.
Selling was recorded throughout the latest trading week. On November 10, the products lost around $13.4 million, followed by $5.9 million on November 11 and another $3.1 million on November 13.
Fidelity’s FSOL accounted for the November 13 withdrawals, while Bitwise’s BSOL recorded some of the largest redemptions during the preceding sessions.
The latest figures add to the selling pressure that had already pushed Solana below $100 in October.
As crypto.news previously reported, SOL fell below $100 on October 29 after spot ETFs recorded $24.82 million in combined withdrawals over two trading sessions.
Broader crypto market selloff weighs on SOL
Solana’s decline has followed losses across major cryptocurrencies, with Bitcoin trading near $64,000 and Ethereum around $1,800 on November 16.
According to CoinMarketCap, the Crypto Fear & Greed Index stood at 12, indicating extreme fear, while total cryptocurrency market capitalization declined 3.73% to approximately $2.18 trillion.
Over the past seven days, Solana has fallen more heavily than Bitcoin and Ethereum, reflecting the continued weakness in its recent price performance.
The latest losses have left SOL with seven consecutive lower weekly closes. Sunday’s closing price of $72.71 was down 40.4% from the September 27 weekly close of $121.96.
The decline has continued despite Solana completing its Alpenglow mainnet upgrade on October 21, which introduced a new consensus system designed to reduce transaction finality times.
Solana price prediction as technical indicators signal further weakness
Solana’s daily chart continues to show lower highs and lower lows, with the cryptocurrency struggling to recover after losing the $80 support level.
The Relative Strength Index stood near 19.80, below the conventional oversold threshold of 30. Such readings indicate substantial selling pressure but do not independently confirm that prices have reached a bottom.
The Moving Average Convergence Divergence indicator remained negative at -7.82, below its signal line of -6.31. Its negative histogram reading of -1.51 suggests that bearish momentum has not yet reversed.
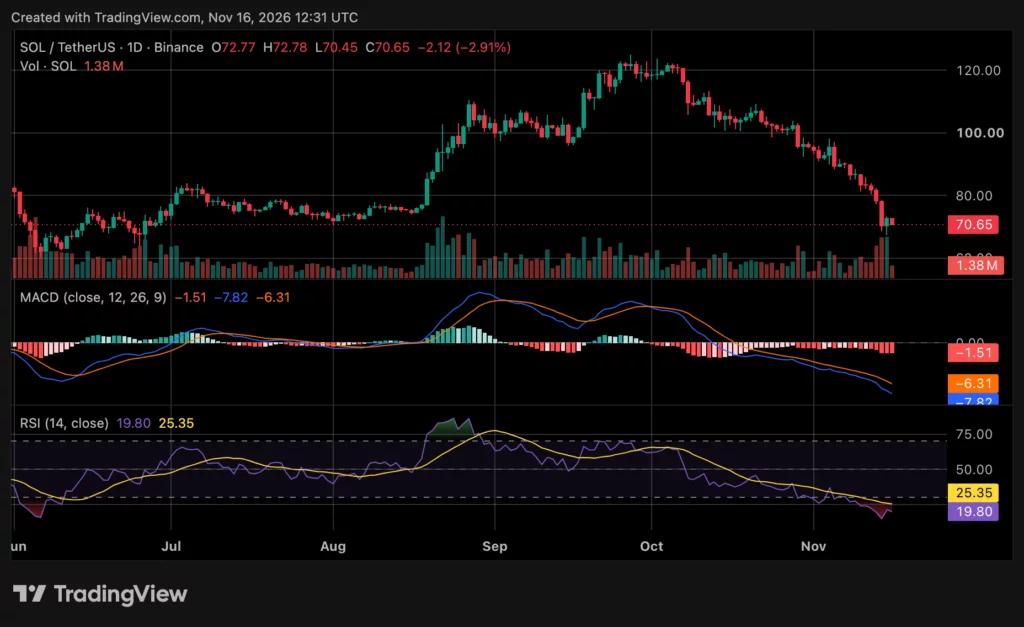
SOL remains below its 50-day, 100-day and 200-day exponential moving averages, reported near $94.62, $95.80 and $96.14, respectively.
The immediate area to watch is $70, followed by support around $68 and $65. A sustained move below those levels could expose the $60 region, while a recovery would first encounter resistance around $73 and $75.
A stronger rebound would need to clear $78.35 before testing the $80 level, which previously served as support.
Technical analyst More Crypto Online observed that SOL had reached its 78.6% Fibonacci retracement near $70, a level associated with the lower boundary of the current corrective structure.
“The upside reaction is not yet strong enough to confirm a low,” the analyst wrote.
The analyst noted that the SOL/BTC ratio had approached support near 0.001, while Solana continued to underperform Bitcoin.
For the coming sessions, the November 16 trading range between $70.48 and $73.18 provides immediate reference points. A sustained move above $75 would be an initial improvement in short-term price momentum, while another break below $70 would leave the recent $67.41 low exposed.
Disclosure: This article does not represent investment advice. The content and materials featured on this page are for educational purposes only.